What is Variance and Why Does it Matter?
In statistical analysis, variance is a fundamental concept that measures the spread or dispersion of a dataset. It provides valuable insights into how individual data points deviate from the mean value, enabling analysts to identify patterns, trends, and correlations. The sum of the squared deviations method is a widely used technique for calculating variance, and its importance cannot be overstated. By grasping the concept of variance, analysts can unlock the full potential of their data, driving business success and informed decision-making. In essence, variance is a crucial metric that helps analysts understand the variability inherent in a dataset, making it an indispensable tool in statistical analysis.

Click Image to Find Quantum Products

Calculating Variance: The Sum of Squared Deviations Method
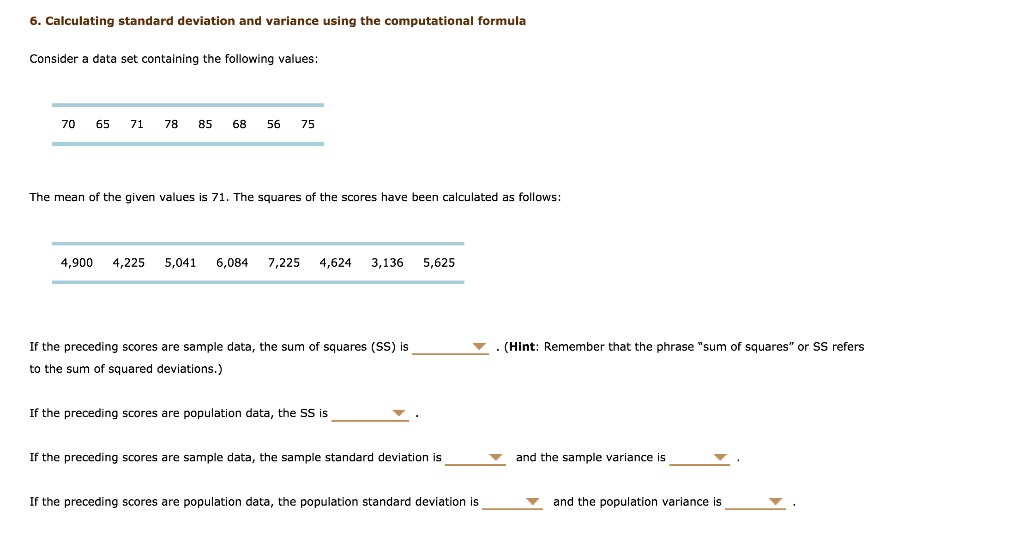
The sum of the squared deviations method is a widely used technique for calculating variance, which is a fundamental concept in statistical analysis. The formula for calculating variance using this method is: σ² = Σ(xi – μ)² / N, where σ² is the variance, xi is each data point, μ is the mean, and N is the number of data points. To calculate variance, follow these steps: first, calculate the mean of the dataset; then, subtract the mean from each data point to find the deviations; next, square each deviation; finally, sum the squared deviations and divide by the number of data points. This method provides an accurate measure of variance, enabling analysts to understand the spread of their data and make informed decisions.

How to Calculate the Sum of Squared Deviations in Real-World Scenarios
In real-world scenarios, the sum of squared deviations method is widely applicable in various fields, including finance, education, and healthcare. For instance, in finance, the sum of squared deviations can be used to analyze stock prices and understand the volatility of the market. Suppose we want to calculate the variance of the daily returns of a stock over a period of 10 days. We can use the sum of squared deviations method by first calculating the mean return, then subtracting the mean from each daily return to find the deviations, squaring each deviation, and finally summing the squared deviations and dividing by the number of days. This calculation provides valuable insights into the stock’s price fluctuations, enabling investors to make informed decisions.
In education, the sum of squared deviations can be used to analyze student grades and understand the dispersion of scores. For example, a teacher can use the sum of squared deviations method to calculate the variance of a class’s scores on a particular exam, identifying areas where students may need additional support. Similarly, in healthcare, the sum of squared deviations can be used to analyze medical data, such as blood pressure readings or patient outcomes, to understand the variability of the data and make informed decisions about patient care.
By applying the sum of squared deviations method in these real-world scenarios, analysts can gain a deeper understanding of their data, identify patterns and trends, and make informed decisions that drive business success.
The Difference Between Population and Sample Variance
In statistical analysis, it is essential to understand the distinction between population and sample variance, as each has its own application and calculation method. Population variance refers to the variance of an entire population, whereas sample variance is an estimate of the population variance based on a subset of data. The sum of squared deviations method can be used to calculate both population and sample variance, but the formula and application differ slightly.
Population variance is calculated using the formula σ² = Σ(xi – μ)² / N, where σ² is the population variance, xi is each data point, μ is the population mean, and N is the total number of data points in the population. This formula is used when the entire population is available, and the goal is to understand the dispersion of the data.
Sample variance, on the other hand, is calculated using the formula s² = Σ(xi – x̄)² / (n – 1), where s² is the sample variance, xi is each data point, x̄ is the sample mean, and n is the number of data points in the sample. This formula is used when only a subset of the population is available, and the goal is to estimate the population variance.
Understanding the difference between population and sample variance is crucial in statistical analysis, as it determines the appropriate calculation method and application. By using the sum of squared deviations method correctly, analysts can ensure accurate calculations and informed decision-making.
Common Applications of Sum of Squared Deviations in Data Analysis
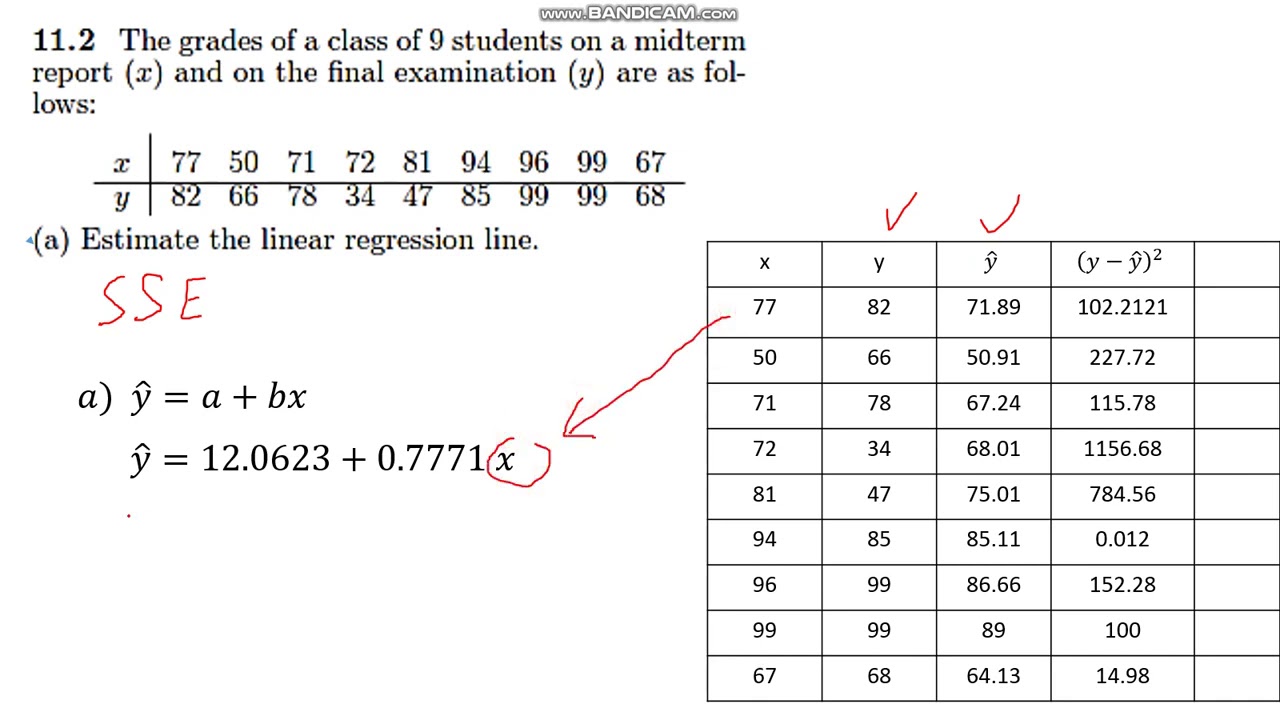
The sum of squared deviations is a fundamental concept in statistical analysis, and its applications are diverse and widespread. One of the most common applications is in regression analysis, where the sum of squared deviations is used to calculate the coefficient of determination (R²), which measures the goodness of fit of a regression model. By analyzing the sum of squared deviations, analysts can determine the proportion of variance in the dependent variable that is explained by the independent variables.
Another important application of the sum of squared deviations is in hypothesis testing, where it is used to calculate the test statistic and p-value. For example, in a t-test, the sum of squared deviations is used to calculate the variance of the sample mean, which is then used to determine whether the sample mean is significantly different from the population mean.
The sum of squared deviations is also used in confidence intervals, where it is used to calculate the margin of error. By analyzing the sum of squared deviations, analysts can determine the range of values within which the true population parameter is likely to lie.
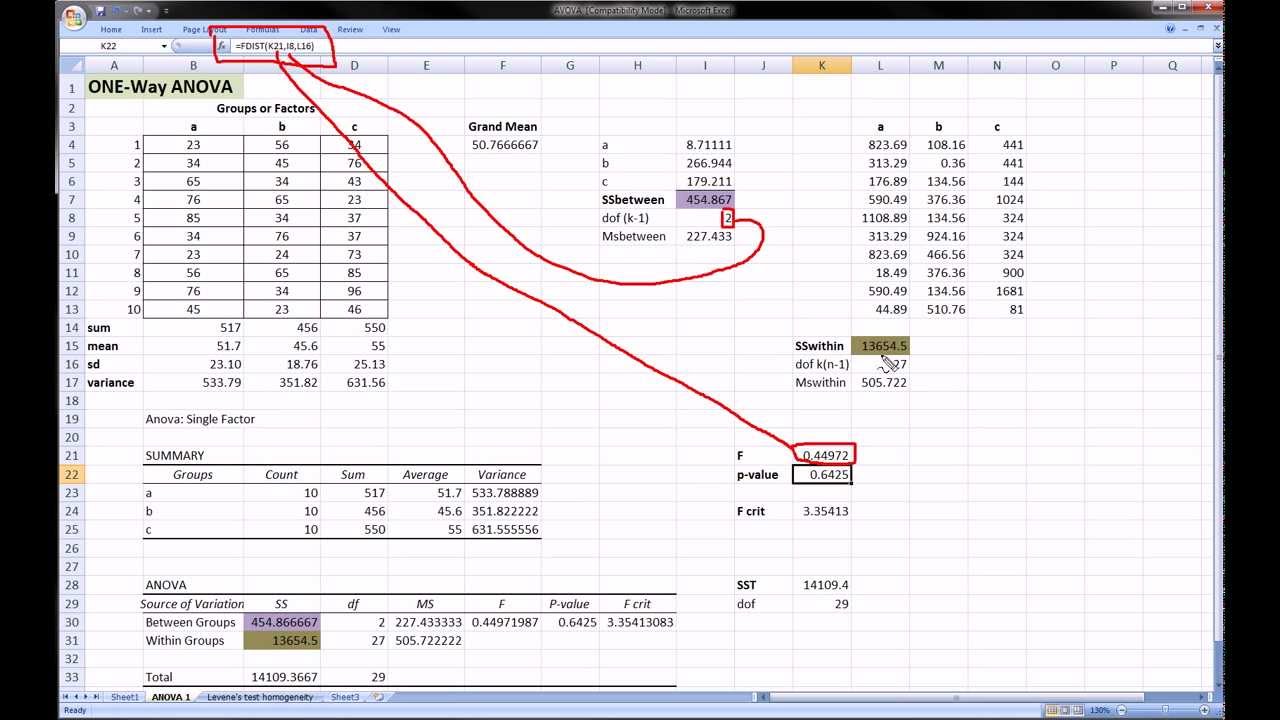
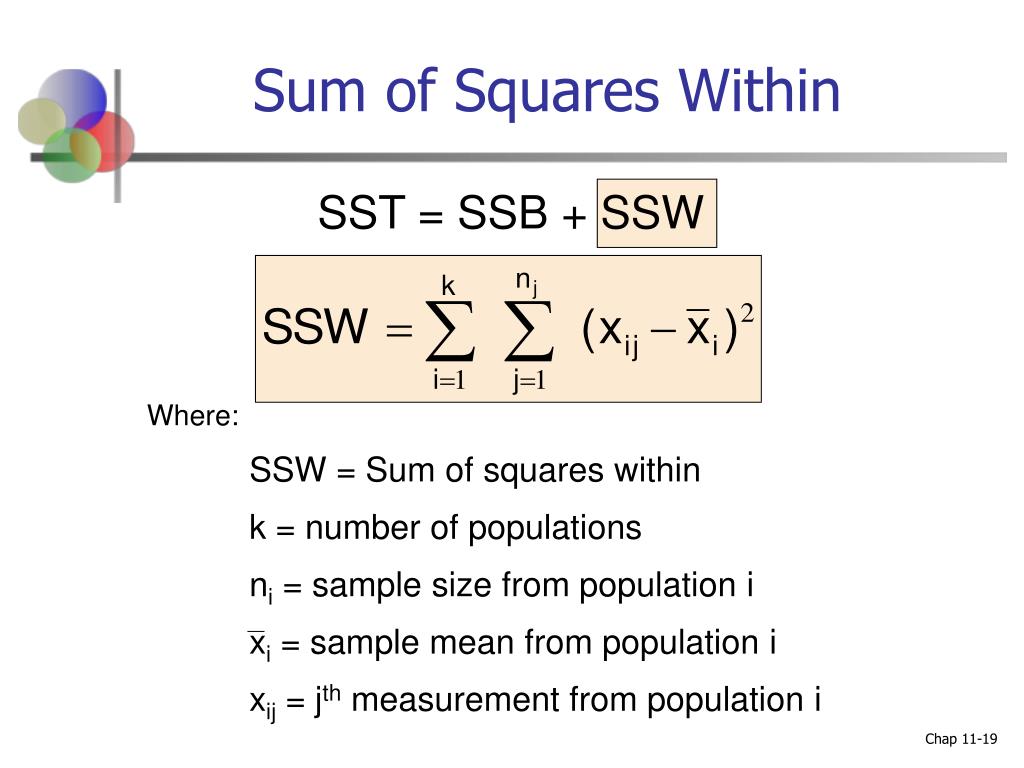
In addition to these applications, the sum of squared deviations is also used in other areas of data analysis, such as ANOVA, time series analysis, and machine learning. In ANOVA, the sum of squared deviations is used to calculate the F-statistic, which is used to determine whether there are significant differences between group means. In time series analysis, the sum of squared deviations is used to calculate the variance of a time series, which is used to identify patterns and trends. In machine learning, the sum of squared deviations is used as a loss function in regression models, where the goal is to minimize the sum of squared deviations between predicted and actual values.
By understanding the various applications of the sum of squared deviations, analysts can unlock the full potential of statistical analysis and make informed decisions in a wide range of fields.
Interpreting Results: What Do the Numbers Really Mean?
Once the sum of squared deviations has been calculated, it’s essential to interpret the results correctly to extract meaningful insights from the data. The sum of squared deviations provides a measure of the dispersion of the data, but it’s crucial to understand what this value represents in the context of the analysis.
A small sum of squared deviations indicates that the data points are closely clustered around the mean, suggesting low variability. In contrast, a large sum of squared deviations indicates that the data points are spread out, suggesting high variability. By analyzing the sum of squared deviations, analysts can identify patterns, trends, and correlations in the data.
For example, in a regression analysis, a small sum of squared deviations may indicate a strong relationship between the independent and dependent variables. In hypothesis testing, a large sum of squared deviations may indicate that the null hypothesis should be rejected, suggesting a significant difference between the sample mean and the population mean.
When interpreting the results of sum of squared deviations calculations, it’s also important to consider the context of the analysis. For instance, in medical research, a small sum of squared deviations may indicate a high degree of precision in the measurement of a medical outcome. In finance, a large sum of squared deviations may indicate high volatility in stock prices.
By correctly interpreting the results of sum of squared deviations calculations, analysts can gain a deeper understanding of the data and make informed decisions in a wide range of fields. The sum of squared deviations is a powerful tool in statistical analysis, and its correct interpretation is essential for extracting meaningful insights from data.
Common Pitfalls to Avoid When Calculating Sum of Squared Deviations
When calculating the sum of squared deviations, it’s essential to avoid common mistakes that can lead to inaccurate results and misinformed decisions. One of the most critical pitfalls to avoid is incorrect data entry, which can occur due to human error or data corruption. A single incorrect data point can significantly affect the sum of squared deviations, leading to misleading conclusions.
Another common pitfall is the presence of outliers in the data. Outliers are data points that are significantly different from the rest of the data, and they can greatly inflate the sum of squared deviations. To avoid this, it’s crucial to identify and handle outliers appropriately, either by removing them or using robust statistical methods that are resistant to outliers.
Bias in the sample is another pitfall to avoid when calculating the sum of squared deviations. A biased sample can lead to a sum of squared deviations that is not representative of the population, resulting in inaccurate conclusions. To avoid bias, it’s essential to ensure that the sample is randomly selected and representative of the population.
In addition to these pitfalls, it’s also important to avoid using the wrong formula or method for calculating the sum of squared deviations. The sum of squared deviations method is sensitive to the choice of formula and method, and using the wrong one can lead to inaccurate results.
By being aware of these common pitfalls, analysts can take steps to avoid them and ensure that their calculations of the sum of squared deviations are accurate and reliable. This is critical in data analysis, where the sum of squared deviations plays a vital role in understanding data dispersion and making informed decisions.
:max_bytes(150000):strip_icc()/sumsquares-56e618233df78c5ba0574656.jpg)
Conclusion: Mastering the Sum of Squared Deviations for Informed Decision-Making
In conclusion, understanding the sum of squared deviations is a crucial aspect of statistical analysis, enabling analysts to measure variability and make informed decisions. By grasping the concept of variance and its importance, analysts can unlock the power of data analysis and drive business success.
The sum of squared deviations method provides a robust approach to calculating variance, and its applications in data analysis are vast and varied. From regression analysis to hypothesis testing and confidence intervals, the sum of squared deviations plays a vital role in extracting insights from data.
By avoiding common pitfalls, such as incorrect data entry, outliers, and biased samples, analysts can ensure that their calculations of the sum of squared deviations are accurate and reliable. This, in turn, enables them to identify patterns, trends, and correlations in data, making informed decisions that drive business success.
In today’s data-driven world, mastering the sum of squared deviations is essential for organizations seeking to gain a competitive edge. By harnessing the power of statistical analysis, businesses can unlock new insights, optimize processes, and drive growth. The sum of squared deviations is a critical component of this process, providing a powerful tool for measuring variability and making informed decisions.
By applying the concepts and techniques outlined in this article, analysts can unlock the full potential of the sum of squared deviations, driving business success and informing decision-making in a wide range of industries.
