Unlocking the Power of Yield to Maturity Calculations
Bond investing is a complex and nuanced field, and understanding yield to maturity is a crucial aspect of making informed investment decisions. Yield to maturity, or YTM, represents the total return on investment an investor can expect to receive from a bond, assuming it is held until maturity. Calculating YTM in Excel is a valuable skill for investors, as it enables them to analyze and compare different bond investments. By mastering yield to maturity calculations in Excel, investors can gain a competitive edge in the market and make more informed decisions about their bond portfolios. With the ability to calculate YTM in Excel, investors can better navigate the complexities of bond investing and make more accurate predictions about their returns.

Click Image to Find Quantum Products
Understanding the Formula: A Deep Dive into Yield to Maturity
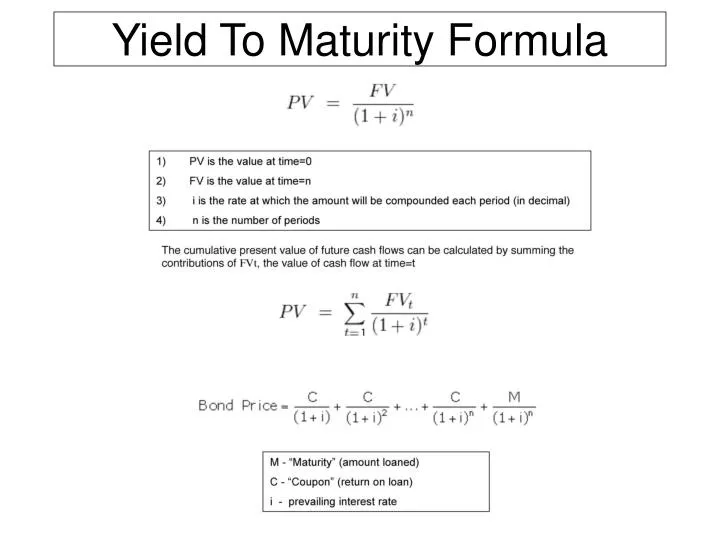
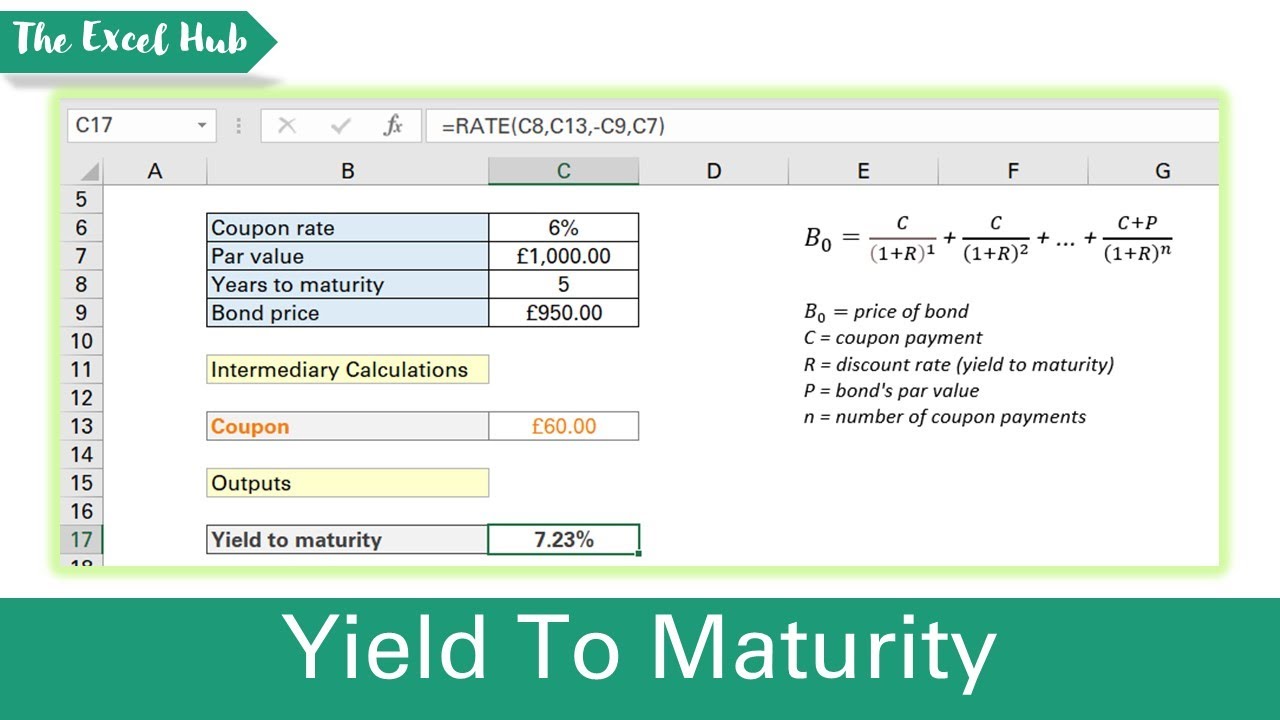
The yield to maturity formula is a complex calculation that takes into account several factors, including the bond’s face value, coupon rate, market price, and time to maturity. The formula is as follows: YTM = (C + ((FV – PV) / years)) / ((FV + PV) / 2), where C is the coupon rate, FV is the face value, PV is the present value, and years is the time to maturity. Breaking down each component of the formula, we can see that the coupon rate represents the annual interest payment made by the bond issuer, while the face value is the bond’s par value. The present value, on the other hand, is the current market price of the bond. By understanding each component of the formula, investors can gain a deeper appreciation for how yield to maturity is calculated and how it can be used to inform investment decisions. In the next section, we will explore how to calculate yield to maturity in Excel, providing a practical approach to implementing the formula in a real-world setting.

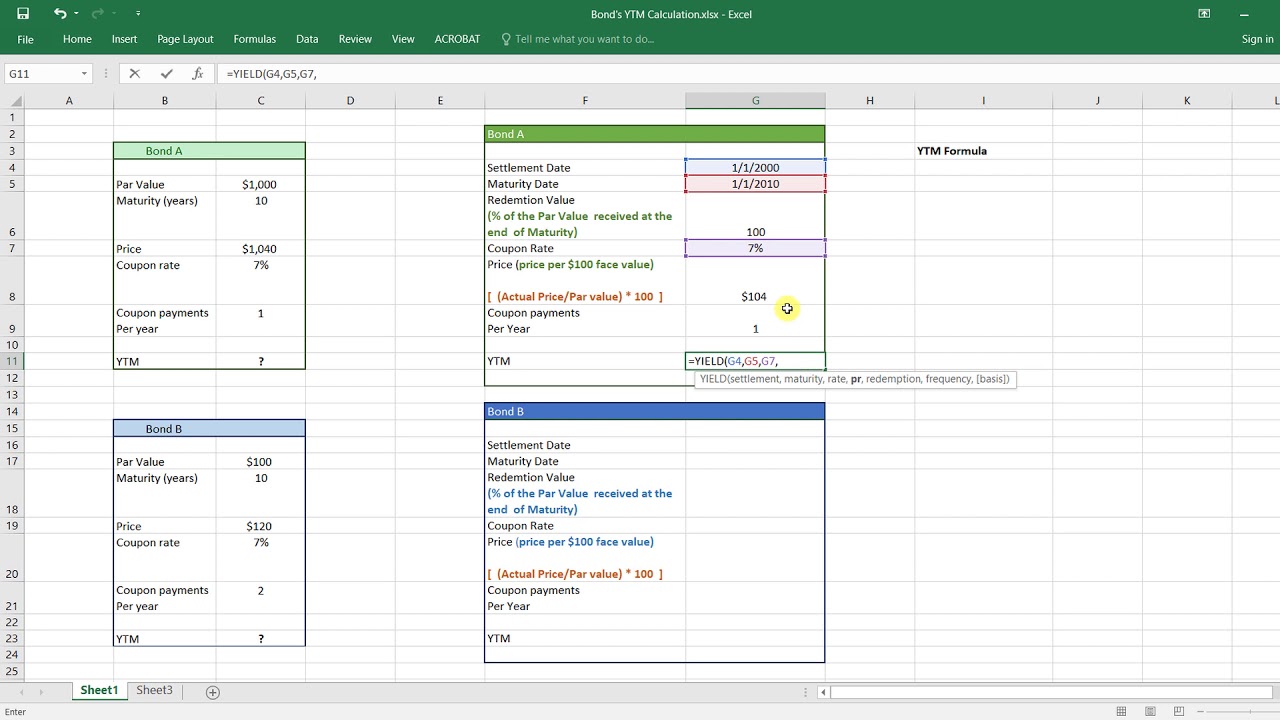
How to Calculate Yield to Maturity in Excel: A Practical Approach
To calculate yield to maturity in Excel, investors can use the YIELD function, which is a built-in formula that takes into account the bond’s face value, coupon rate, market price, and time to maturity. The syntax for the YIELD function is as follows: YIELD(settlement, maturity, rate, pr, redemption, frequency, [basis]). In this formula, settlement represents the bond’s issue date, maturity is the bond’s expiration date, rate is the coupon rate, pr is the market price, redemption is the face value, frequency is the number of coupon payments per year, and basis is the day count basis. To illustrate this concept, let’s consider an example. Suppose we have a bond with a face value of $1,000, a coupon rate of 5%, and a market price of $900. Using the YIELD function, we can calculate the yield to maturity as follows: =YIELD(A1, B1, C1, D
Common Errors to Avoid When Calculating Yield to Maturity in Excel
When calculating yield to maturity in Excel, investors often make common mistakes that can lead to inaccurate results. One of the most common errors is incorrect data entry, such as entering the wrong settlement date or maturity date. This can result in a yield to maturity calculation that is significantly off from the actual value. To avoid this mistake, investors should double-check their data entry to ensure that it is accurate and consistent. Another common error is using the wrong formula or function, such as using the IRR function instead of the YIELD function. This can lead to a calculation that is not tailored to the specific bond being analyzed. To avoid this mistake, investors should familiarize themselves with the YIELD function and its syntax. Additionally, investors should be aware of the assumptions underlying the yield to maturity calculation, such as the assumption of semi-annual compounding. By understanding these assumptions, investors can avoid making mistakes that can impact their investment decisions. By avoiding these common errors, investors can ensure that their yield to maturity calculations in Excel are accurate and reliable, providing a solid foundation for informed investment decisions. Furthermore, using Excel to calculate yield to maturity can help investors to identify potential errors and inconsistencies in their data, allowing them to make more informed decisions. By leveraging the power of yield to maturity calculations in Excel, investors can take their bond investing to the next level.
Real-World Applications of Yield to Maturity Calculations in Excel
In the world of bond investing, yield to maturity calculations play a critical role in informing investment decisions. By using Excel to calculate yield to maturity, investors can gain a deeper understanding of their bond portfolios and make more informed decisions. One of the most significant real-world applications of yield to maturity calculations in Excel is in bond portfolio management. By calculating the yield to maturity of individual bonds, investors can determine the overall return on investment of their portfolio and make adjustments to optimize performance. Additionally, yield to maturity calculations can be used to evaluate the creditworthiness of bond issuers and assess the risk associated with individual bonds. This information can be used to create a diversified portfolio that balances risk and return. Another important application of yield to maturity calculations in Excel is in investment analysis. By comparing the yield to maturity of different bonds, investors can identify opportunities to generate higher returns or reduce risk. This analysis can be used to inform investment decisions and optimize portfolio performance. Furthermore, yield to maturity calculations can be used to evaluate the impact of changes in interest rates on bond prices and yields. This information can be used to adjust investment strategies and minimize losses. By leveraging the power of yield to maturity calculations in Excel, investors can gain a competitive edge in the bond market and make more informed investment decisions. Whether you’re a seasoned investor or just starting out, understanding how to calculate yield to maturity in Excel can help you take your bond investing to the next level.
Advanced Yield to Maturity Calculations in Excel: Tips and Tricks
Once you’ve mastered the basics of calculating yield to maturity in Excel, it’s time to take your skills to the next level. By leveraging advanced techniques and shortcuts, you can streamline your workflow, reduce errors, and gain a deeper understanding of your bond portfolio. One advanced technique is to use Excel add-ins, such as the Analysis ToolPak, to calculate yield to maturity. This add-in provides a range of financial functions, including the YIELD function, which can be used to calculate yield to maturity with ease. Another advanced technique is to use Excel macros to automate the yield to maturity calculation process. By recording a macro, you can create a custom button that calculates yield to maturity with a single click, saving you time and effort. Additionally, you can use Excel’s built-in functions, such as the XNPV function, to calculate yield to maturity for more complex bond structures, such as zero-coupon bonds or bonds with irregular cash flows. By using these advanced techniques and shortcuts, you can take your yield to maturity calculations in Excel to the next level and gain a competitive edge in the bond market. Furthermore, you can use Excel’s data analysis tools, such as pivot tables and charts, to visualize your yield to maturity calculations and gain a deeper understanding of your bond portfolio. By combining these advanced techniques with a solid understanding of yield to maturity calculations in Excel, you can make more informed investment decisions and optimize your bond portfolio for maximum returns.

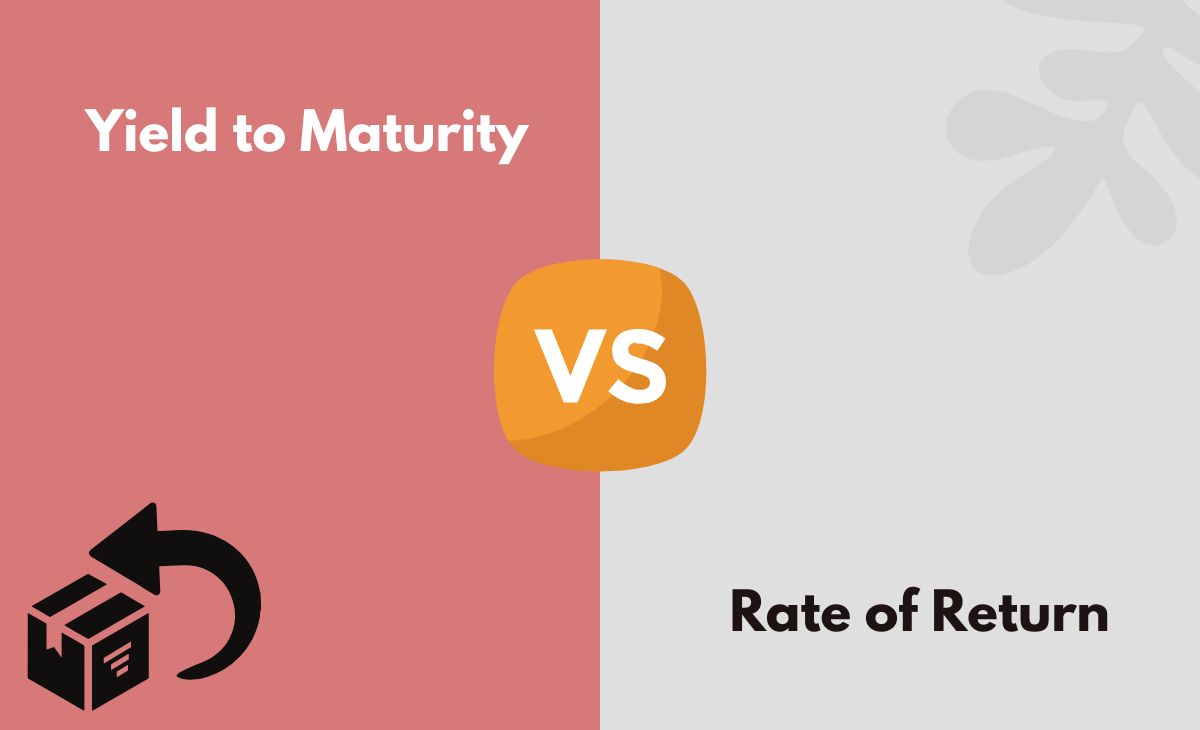
Yield to Maturity vs. Current Yield: Understanding the Difference
In the world of bond investing, understanding the difference between yield to maturity and current yield is crucial for making informed investment decisions. While both concepts are related to bond yields, they represent distinct measures of a bond’s return on investment. Yield to maturity, as discussed earlier, represents the total return on investment of a bond, taking into account the coupon rate, face value, and market price. On the other hand, current yield represents the bond’s annual return based on its current market price and coupon rate. The key difference between the two lies in their scope: yield to maturity looks at the bond’s entire lifespan, while current yield focuses on the bond’s current performance. To illustrate the distinction, consider a bond with a face value of $1,000, a coupon rate of 5%, and a current market price of $900. The yield to maturity would take into account the bond’s entire lifespan, including the coupon payments and the return of principal at maturity. In contrast, the current yield would only consider the bond’s current market price and coupon rate, providing a snapshot of the bond’s current performance. Understanding the difference between yield to maturity and current yield is essential for bond investors, as it allows them to make more informed decisions about their investments. By using Excel to calculate both yield to maturity and current yield, investors can gain a more comprehensive understanding of their bond portfolios and optimize their investment strategies. Whether you’re a seasoned investor or just starting out, grasping the distinction between these two critical concepts can help you make more informed decisions and achieve your investment goals.
Conclusion: Taking Your Bond Investing to the Next Level with Excel
In conclusion, mastering yield to maturity calculations in Excel is a crucial skill for bond investors seeking to optimize their investment portfolios. By understanding the concept of yield to maturity, grasping the formula, and learning how to calculate it in Excel, investors can make more informed decisions about their bond investments. Additionally, avoiding common errors, exploring real-world applications, and leveraging advanced techniques can further enhance their investment strategies. By recognizing the distinction between yield to maturity and current yield, investors can gain a more comprehensive understanding of their bond portfolios. By harnessing the power of Excel to calculate yield to maturity, investors can streamline their workflow, reduce errors, and achieve their investment goals. Whether you’re a seasoned investor or just starting out, this guide has provided a comprehensive roadmap for mastering yield to maturity calculations in Excel. By applying the concepts and techniques outlined in this article, you can take your bond investing to the next level and achieve long-term success in the world of fixed-income investing. Remember, yield to maturity in Excel is not just a calculation – it’s a key to unlocking better investment decisions and achieving your financial goals.