What Lies Behind the Curve: Understanding Skewness in Statistics
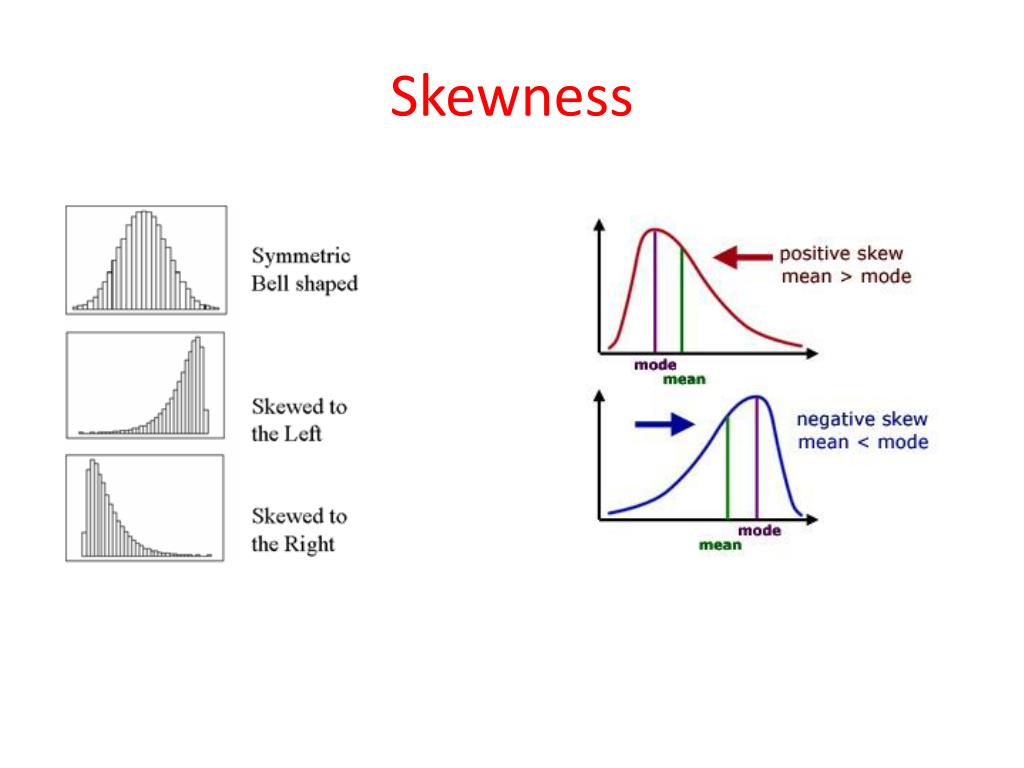
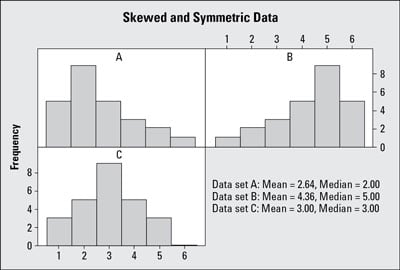
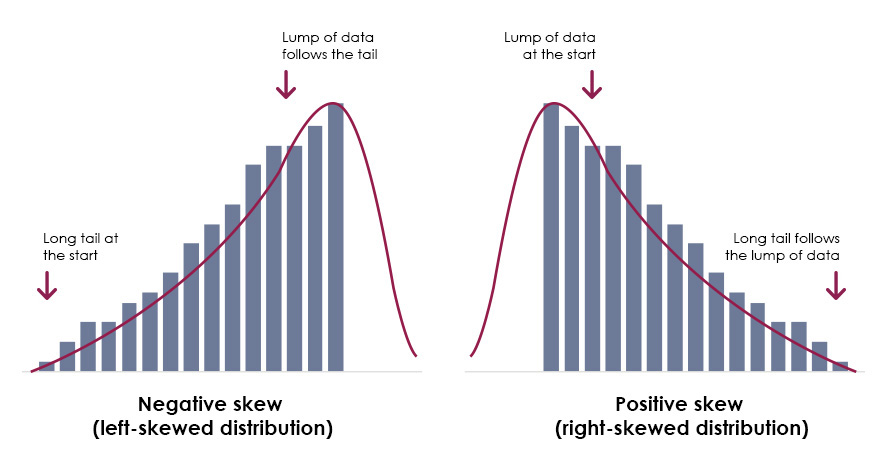
In statistics, skewness refers to the asymmetry of a probability distribution, which can significantly impact the accuracy of statistical analysis and modeling. A skewed distribution is one where the data points are not evenly distributed around the mean, resulting in a curve that is not symmetrical. Skewness can be either positive or negative, depending on the direction of the asymmetry. What is a negatively skewed distribution? It is a type of distribution where the majority of the data points are concentrated on the right side of the mean, resulting in a longer tail on the left side. Understanding skewness is essential in identifying and working with negatively skewed distributions, which is a common phenomenon in many real-world datasets. There are different types of skewness, including negative skewness, positive skewness, and zero skewness. Negative skewness is characterized by a longer tail on the left side of the mean, while positive skewness is characterized by a longer tail on the right side of the mean. Zero skewness, on the other hand, refers to a symmetrical distribution where the mean and median values are equal. Skewness can affect data distribution and analysis in various ways, including altering the mean and median values, and influencing the results of statistical tests and models. By recognizing and understanding skewness, data analysts and researchers can make more accurate predictions and informed decisions. In the following sections, we will delve deeper into the characteristics and implications of negatively skewed distributions, and explore practical tips for working with these types of distributions.
Identifying Negatively Skewed Distributions: Key Characteristics and Examples
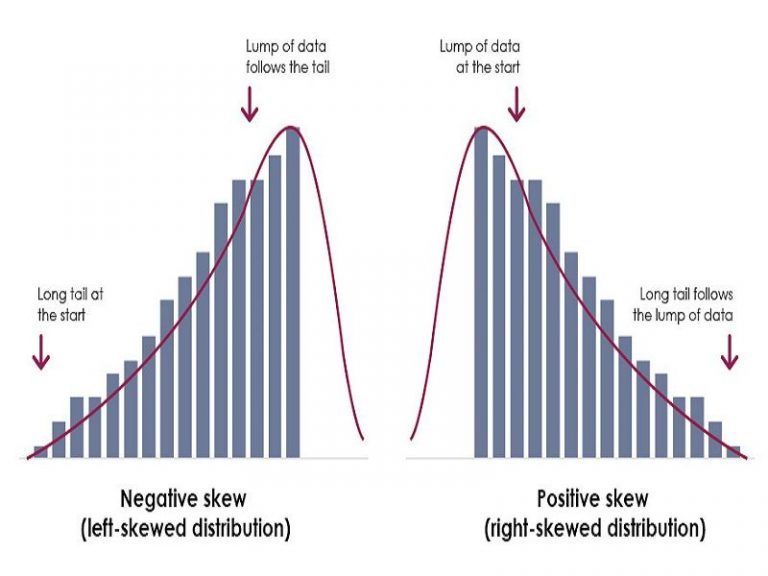
A negatively skewed distribution is a type of distribution that exhibits a unique set of characteristics. One of the most distinctive features of a negatively skewed distribution is the clustering of data points on the right side of the mean. This means that the majority of the data points are concentrated on the right side of the mean, resulting in a longer tail on the left side. Another key characteristic of negatively skewed distributions is the presence of outliers or extreme values on the left side of the mean. These outliers can significantly impact the mean and median values, leading to inaccurate predictions and biased results. Real-world examples of negatively skewed distributions include exam scores, income data, and stock prices. For instance, in a class of students, the majority of students may score high grades, with a few students scoring very low grades, resulting in a negatively skewed distribution. Similarly, income data may exhibit a negatively skewed distribution, where a small percentage of individuals earn very high incomes, while the majority earn lower incomes. By recognizing these characteristics, data analysts and researchers can identify negatively skewed distributions and take steps to mitigate their effects on statistical analysis and modeling.
How to Recognize and Interpret Negatively Skewed Data in Real-Life Scenarios
In various contexts, including business, economics, and social sciences, recognizing and interpreting negatively skewed data is crucial for making informed decisions. To identify negatively skewed data, look for distributions where the majority of the data points are clustered on the right side of the mean, with a longer tail on the left side. This can be observed in datasets such as customer purchase amounts, where a small percentage of customers make large purchases, while the majority make smaller purchases. In economics, negatively skewed data can be seen in income distributions, where a small percentage of individuals earn very high incomes, while the majority earn lower incomes. To interpret negatively skewed data, it’s essential to understand the underlying causes of the skewness. For instance, in a business setting, a negatively skewed distribution of customer purchase amounts may indicate that a small percentage of customers are driving a large percentage of revenue. This insight can inform marketing strategies and customer segmentation. In social sciences, negatively skewed data can reveal underlying social and economic inequalities. By recognizing and interpreting negatively skewed data, researchers and analysts can gain valuable insights and make data-driven decisions. What is a negatively skewed distribution? It is a distribution that exhibits a unique set of characteristics, including the clustering of data points on the right side of the mean. By understanding these characteristics, data analysts and researchers can identify and work with negatively skewed distributions to uncover hidden patterns and insights.
The Impact of Negatively Skewed Distributions on Statistical Analysis and Modeling
Negatively skewed distributions can have a significant impact on statistical analysis and modeling. One of the primary concerns is the potential for biased results and inaccurate predictions. This is because traditional statistical methods, such as linear regression, assume normality or symmetry in the data. However, negatively skewed distributions violate this assumption, leading to inaccurate estimates and predictions. For instance, in finance, a negatively skewed distribution of stock prices may lead to underestimation of risk and overestimation of returns. To mitigate these effects, data analysts and researchers can employ various methods, including data transformation and robust regression. Data transformation involves transforming the data to reduce skewness, such as taking the logarithm or square root of the data. Robust regression, on the other hand, involves using alternative regression methods that are resistant to outliers and skewness, such as quantile regression or robust linear regression. By understanding the impact of negatively skewed distributions on statistical analysis and modeling, data analysts and researchers can take steps to ensure accurate and reliable results. What is a negatively skewed distribution? It is a distribution that exhibits a unique set of characteristics, including the clustering of data points on the right side of the mean. By recognizing and addressing the implications of negatively skewed distributions, data analysts and researchers can gain a deeper understanding of their data and make more informed decisions.
Visualizing Negatively Skewed Distributions: The Role of Histograms and Density Plots
Visualization is a crucial step in understanding negatively skewed distributions. By creating effective histograms and density plots, data analysts and researchers can gain a deeper understanding of the characteristics of negatively skewed data. Histograms, for instance, can help identify the clustering of data points on the right side of the mean, which is a hallmark of negatively skewed distributions. Density plots, on the other hand, can provide a more detailed view of the distribution, highlighting the skewness and kurtosis of the data. To create effective histograms and density plots, it’s essential to choose the right bin width and kernel density estimation method. A bin width that is too small can result in a noisy histogram, while a bin width that is too large can obscure important features of the distribution. Similarly, the choice of kernel density estimation method can affect the accuracy of the density plot. By using visualization tools effectively, data analysts and researchers can uncover hidden patterns and insights in negatively skewed data. What is a negatively skewed distribution? It is a distribution that exhibits a unique set of characteristics, including the clustering of data points on the right side of the mean. By visualizing negatively skewed distributions, data analysts and researchers can gain a deeper understanding of their data and make more informed decisions. Effective visualization can also help communicate complex statistical concepts to non-technical stakeholders, making it an essential tool in data analysis and decision-making.
Common Misconceptions and Pitfalls in Working with Negatively Skewed Distributions
When working with negatively skewed distributions, it’s essential to avoid common misconceptions and pitfalls that can lead to inaccurate analysis and misleading results. One of the most common mistakes is assuming normality, which can result in the misuse of statistical methods and incorrect conclusions. Another pitfall is ignoring outliers, which can significantly impact the accuracy of statistical models and predictions. Additionally, failing to account for skewness can lead to biased results and inaccurate predictions. To avoid these mistakes, data analysts and researchers should always test for skewness and normality, and use robust statistical methods that can handle non-normal data. It’s also crucial to carefully examine the data for outliers and anomalies, and to use data transformation techniques to reduce skewness. By being aware of these common misconceptions and pitfalls, data analysts and researchers can ensure accurate and reliable analysis of negatively skewed distributions. What is a negatively skewed distribution? It is a distribution that exhibits a unique set of characteristics, including the clustering of data points on the right side of the mean. By understanding the common pitfalls and misconceptions associated with negatively skewed distributions, data analysts and researchers can gain a deeper understanding of their data and make more informed decisions.
Real-World Applications of Negatively Skewed Distributions: Case Studies and Examples
Negatively skewed distributions are not just theoretical concepts, but have real-world applications in various fields. In finance, for instance, the distribution of stock prices can be negatively skewed, with a few extreme outliers on the right side of the mean. Understanding and working with negatively skewed distributions in finance can help investors and analysts make more informed investment decisions and manage risk more effectively. In marketing, the distribution of customer responses to a survey or the distribution of sales data can also be negatively skewed. By recognizing and interpreting negatively skewed data, marketers can identify opportunities to target specific customer segments and optimize their marketing strategies. In healthcare, the distribution of patient outcomes or the distribution of disease incidence rates can also exhibit negative skewness. By understanding and working with negatively skewed distributions in healthcare, researchers and practitioners can identify patterns and trends that can inform treatment decisions and improve patient outcomes. What is a negatively skewed distribution? It is a distribution that exhibits a unique set of characteristics, including the clustering of data points on the right side of the mean. By recognizing and working with negatively skewed distributions in real-world scenarios, data analysts and researchers can gain a deeper understanding of their data and make more informed decisions. For example, a study on the distribution of exam scores in a university found that the scores were negatively skewed, with a few students scoring extremely high. By recognizing and interpreting this negatively skewed distribution, the university was able to identify opportunities to provide additional support to struggling students and to develop more challenging coursework for high-achieving students.
Mastering Negatively Skewed Distributions: Best Practices for Data Analysts and Researchers
To effectively work with negatively skewed distributions, data analysts and researchers must follow best practices that ensure accurate analysis and informed decision-making. One key practice is to carefully prepare the data, including checking for outliers and anomalies, and transforming the data if necessary. Another important practice is to select the appropriate statistical models and techniques, such as robust regression or non-parametric tests, that can handle negatively skewed data. Additionally, data analysts and researchers should be aware of the potential pitfalls and misconceptions associated with negatively skewed distributions, such as assuming normality or ignoring outliers. By following these best practices, data analysts and researchers can gain a deeper understanding of negatively skewed distributions and make more informed decisions. What is a negatively skewed distribution? It is a distribution that exhibits a unique set of characteristics, including the clustering of data points on the right side of the mean. By mastering negatively skewed distributions, data analysts and researchers can unlock new insights and opportunities in various fields, from finance to healthcare. For instance, in finance, understanding negatively skewed distributions can help investors and analysts identify opportunities for growth and manage risk more effectively. In healthcare, understanding negatively skewed distributions can help researchers and practitioners identify patterns and trends that can inform treatment decisions and improve patient outcomes. By following best practices and expert advice, data analysts and researchers can ensure accurate analysis and informed decision-making when working with negatively skewed distributions.


