What is Skewness in Statistics?
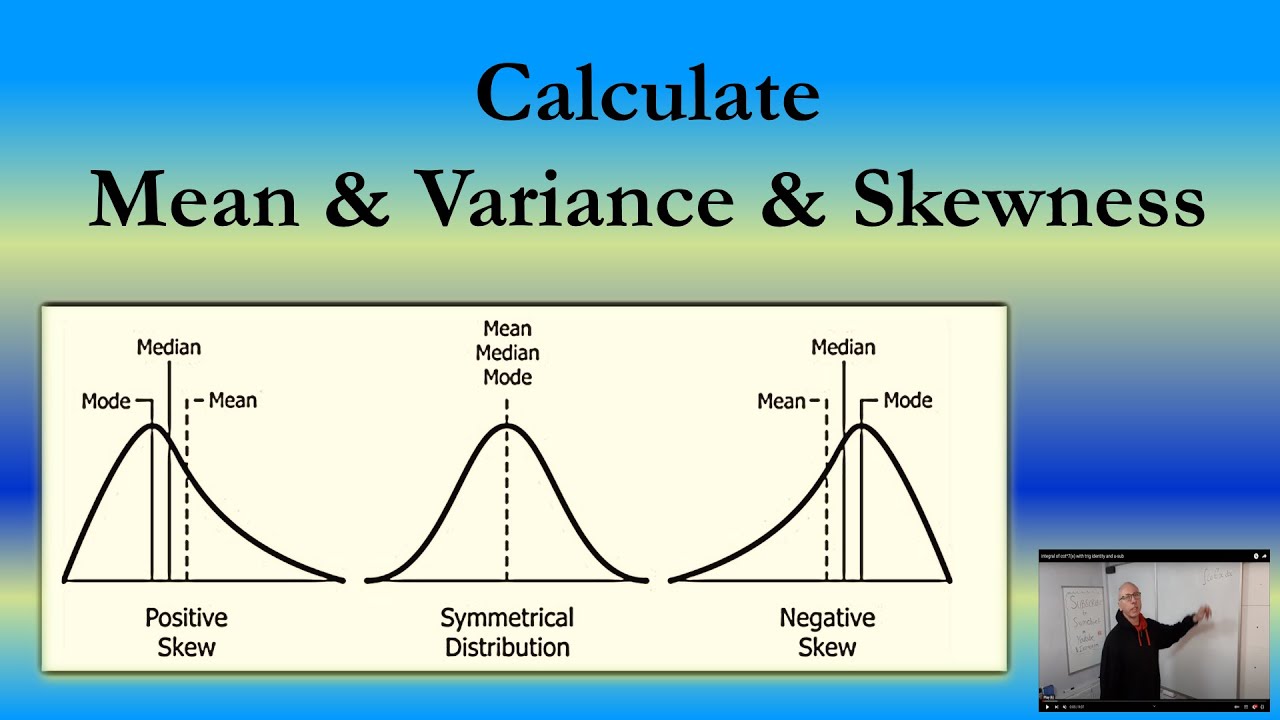
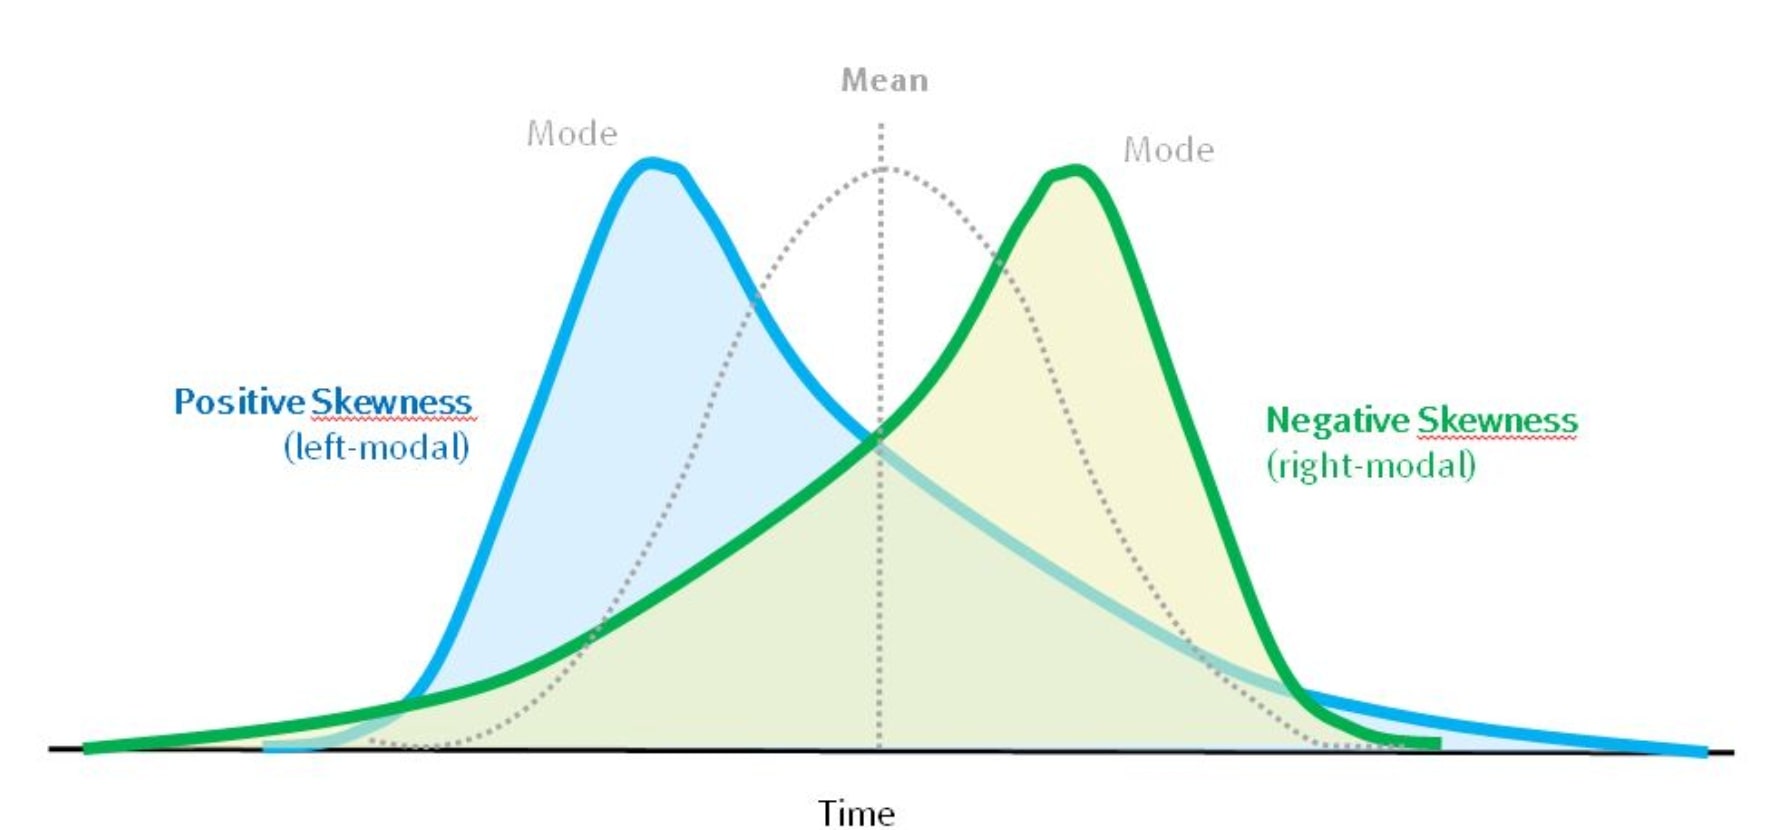
In statistics, skewness is a measure of the asymmetry of a probability distribution. It’s a crucial concept in data analysis, as it significantly impacts the interpretation of results and the choice of statistical methods. Skewness can be either positive or negative, depending on the direction of the asymmetry. Positive skew, also known as right-skewed, occurs when the majority of the data points are clustered on the left side of the mean, with a long tail of values extending to the right. On the other hand, negative skew, or left-skewed, occurs when the data points are clustered on the right side of the mean, with a long tail extending to the left. Understanding skewness is essential in data analysis, as it can affect the accuracy of statistical models and lead to incorrect conclusions. When asking “what does positive skew mean,” it’s essential to recognize the importance of skewness in statistical modeling and its implications for data analysis.

Click Image to Find Quantum Products
Identifying Positive Skew: How to Recognize the Pattern
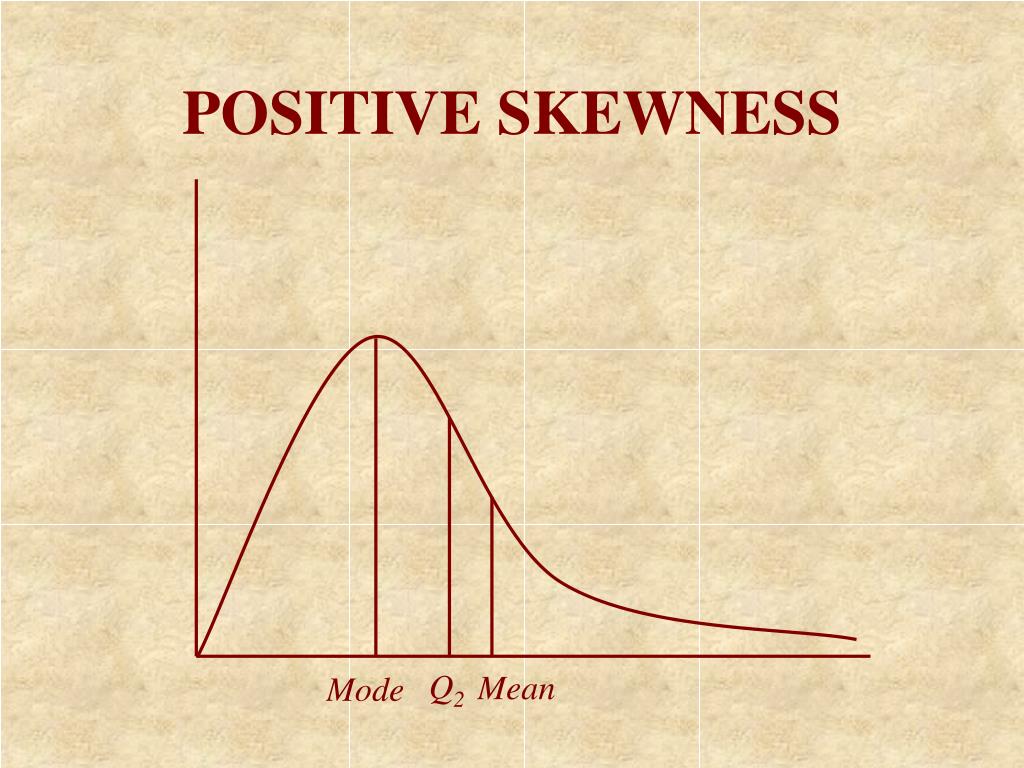
Positive skew, also known as right-skewed, is a type of skewness where the majority of the data points are clustered on the left side of the mean, with a long tail of values extending to the right. This asymmetrical distribution is characterized by a few extreme values that are significantly higher than the mean, pulling the distribution to the right. When asking “what does positive skew mean,” it’s essential to recognize these distinctive features. In a positively skewed distribution, the mean is typically greater than the median, and the mode is often the lowest value. Real-world examples of positive skew can be seen in income distributions, where a small percentage of high-income earners skew the distribution to the right, or in stock prices, where a few extreme values can greatly impact the overall distribution.

How to Interpret Positive Skew in Data Analysis
When dealing with positively skewed data, it’s essential to understand the implications on data analysis. One of the primary concerns is the potential for biased results. Since the mean is pulled to the right by the extreme values, it may not accurately represent the typical value in the dataset. This can lead to incorrect conclusions and poor decision-making. Furthermore, traditional statistical methods, such as regression analysis, may not be suitable for positively skewed data, as they assume normality or symmetry. In such cases, specialized statistical techniques, such as robust regression or non-parametric methods, may be necessary to ensure accurate results. When asking “what does positive skew mean,” it’s crucial to recognize the need for adapted analytical approaches to handle the unique characteristics of positively skewed data.
The Causes of Positive Skew: Understanding the Underlying Factors
Positive skew can arise from various underlying factors, including outliers, non-normality, and sampling bias. Outliers, which are extreme values that deviate significantly from the rest of the data, can pull the distribution to the right, creating a positive skew. Non-normality, or the lack of a normal distribution, can also lead to positive skew, as the data may not follow a symmetrical pattern. Sampling bias, which occurs when the sample is not representative of the population, can also result in positively skewed data. For instance, if a sample is drawn from a population with a high proportion of extreme values, the resulting data may exhibit positive skew. Understanding these underlying factors is crucial in identifying the root cause of positive skew and developing effective strategies to address it. When asking “what does positive skew mean,” it’s essential to recognize the role of these factors in shaping the distribution of the data.
In addition, other factors such as measurement errors, data entry errors, and incorrect data transformation can also contribute to positive skew. In some cases, positive skew can be a result of the natural phenomenon being studied, such as the distribution of income or city sizes. In these cases, it’s essential to understand the underlying mechanisms that generate the data and develop appropriate analytical approaches to handle the positive skew.
Real-World Examples of Positive Skew in Action
Positive skew is a common phenomenon in various fields, and understanding its practical significance is essential for making informed decisions. In finance, for instance, the distribution of stock prices often exhibits positive skew, with a few extreme values on the right side of the mean. This is because stock prices can experience sudden surges, leading to a long tail of values. Similarly, in healthcare, the distribution of patient wait times may exhibit positive skew, with a few patients experiencing extremely long wait times.
In social sciences, the distribution of income often exhibits positive skew, with a few individuals earning significantly more than the rest of the population. This is because income is often influenced by factors such as education, experience, and occupation, which can lead to a skewed distribution. Understanding positive skew in these contexts is crucial for developing effective policies and interventions.
Other examples of positive skew can be seen in the distribution of city sizes, with a few large cities and many smaller ones, and in the distribution of website traffic, with a few popular websites receiving a disproportionate amount of traffic. In each of these cases, understanding the implications of positive skew is essential for making informed decisions and developing effective strategies. When asking “what does positive skew mean,” it’s essential to recognize its practical significance in various fields and industries.

Dealing with Positive Skew: Strategies for Data Analysis
When working with positively skewed data, it’s essential to employ specialized strategies to ensure accurate and reliable results. One approach is to transform the data using techniques such as logarithmic or square root transformations, which can help to reduce the skewness and make the data more amenable to analysis. Another approach is to use robust statistical methods, such as median-based estimators, which are less sensitive to outliers and skewness.
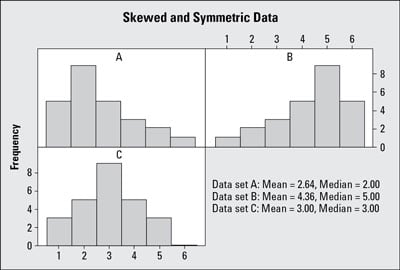
Visualization techniques, such as histograms and box plots, can also be useful for identifying and understanding positive skew. These techniques can help to reveal the underlying pattern of the data and identify potential outliers or anomalies. Additionally, data analysts can use specialized software and programming languages, such as R or Python, which offer a range of tools and techniques for handling positively skewed data.
When asking “what does positive skew mean,” it’s essential to recognize the importance of using appropriate analytical techniques to handle skewed data. By employing these strategies, data analysts can ensure that their results are accurate and reliable, and that they are able to extract meaningful insights from the data. This is particularly important in fields such as finance, healthcare, and social sciences, where positively skewed data is common and accurate analysis is critical.
Furthermore, data analysts can also use techniques such as winsorization, which involves replacing extreme values with a specified percentile, to reduce the impact of outliers on the analysis. Another approach is to use non-parametric tests, which do not assume normality, to analyze the data. By using these strategies, data analysts can ensure that their results are robust and reliable, even in the presence of positive skew.
Common Mistakes to Avoid When Working with Positively Skewed Data
When working with positively skewed data, it’s essential to avoid common pitfalls that can lead to misinterpretation of results or inaccurate conclusions. One common mistake is to assume that the data follows a normal distribution, which can lead to the use of inappropriate statistical methods. This can result in biased estimates and incorrect conclusions.
Another mistake is to ignore the presence of outliers, which can have a significant impact on the analysis. Outliers can greatly influence the mean and variance of the data, leading to inaccurate results. Additionally, failing to account for the skewness of the data can lead to incorrect conclusions about the population parameters.
Furthermore, using statistical methods that are sensitive to skewness, such as t-tests and ANOVA, can also lead to inaccurate results. These methods assume normality, which is not always the case with positively skewed data. When asking “what does positive skew mean,” it’s essential to recognize the importance of using appropriate statistical methods that account for the skewness of the data.
Other common mistakes include failing to visualize the data, which can help to identify the presence of skewness and outliers, and not considering alternative distributions, such as the lognormal or gamma distributions, which may better fit the data. By being aware of these common mistakes, data analysts can avoid pitfalls and ensure that their results are accurate and reliable.

Mastering Positive Skew: Tips for Advanced Data Analysts
For advanced data analysts, working with positively skewed data requires a deep understanding of specialized techniques and tools. One approach is to use programming languages such as R or Python, which offer a range of libraries and packages specifically designed for handling skewed data. For example, the “skewt” package in R provides a range of functions for analyzing and visualizing skewed data.
Another approach is to use specialized software such as SAS or SPSS, which offer advanced statistical techniques for handling skewed data. These software packages provide a range of tools for data transformation, robust statistical methods, and visualization techniques, making it easier to analyze and interpret positively skewed data.
In addition, advanced data analysts can use machine learning algorithms such as decision trees and random forests, which are robust to skewness and can handle large datasets. These algorithms can help to identify patterns and relationships in the data that may not be apparent through traditional statistical methods.
When asking “what does positive skew mean,” advanced data analysts should also consider the use of Bayesian statistics, which provide a flexible framework for modeling skewed data. Bayesian methods allow for the incorporation of prior knowledge and uncertainty, making them particularly useful for handling complex datasets.
Furthermore, advanced data analysts can use data visualization techniques such as violin plots and bean plots, which provide a more detailed and nuanced view of the data distribution. These plots can help to identify patterns and outliers in the data, making it easier to interpret and analyze positively skewed data.
By mastering these advanced techniques and tools, data analysts can unlock the secrets of positively skewed data and gain a deeper understanding of the underlying patterns and relationships. This can lead to more accurate and reliable results, and a greater ability to extract insights and value from the data.
