Unlocking the Secrets of Investment Performance
Investment success hinges on the ability to navigate the intricate relationship between risk and reward. At the heart of this relationship lies two crucial metrics: standard deviation and expected return. Standard deviation and expected return serve as the cornerstones of investment analysis, providing valuable insights into the potential risks and rewards associated with a particular investment. By grasping the concepts of standard deviation and expected return, investors can make informed decisions that balance risk and potential returns, ultimately leading to more effective investment strategies. In this article, we will delve into the world of standard deviation and expected return, exploring their significance in investment analysis and providing practical guidance on how to apply them in real-world scenarios.
What is Standard Deviation in Investing?
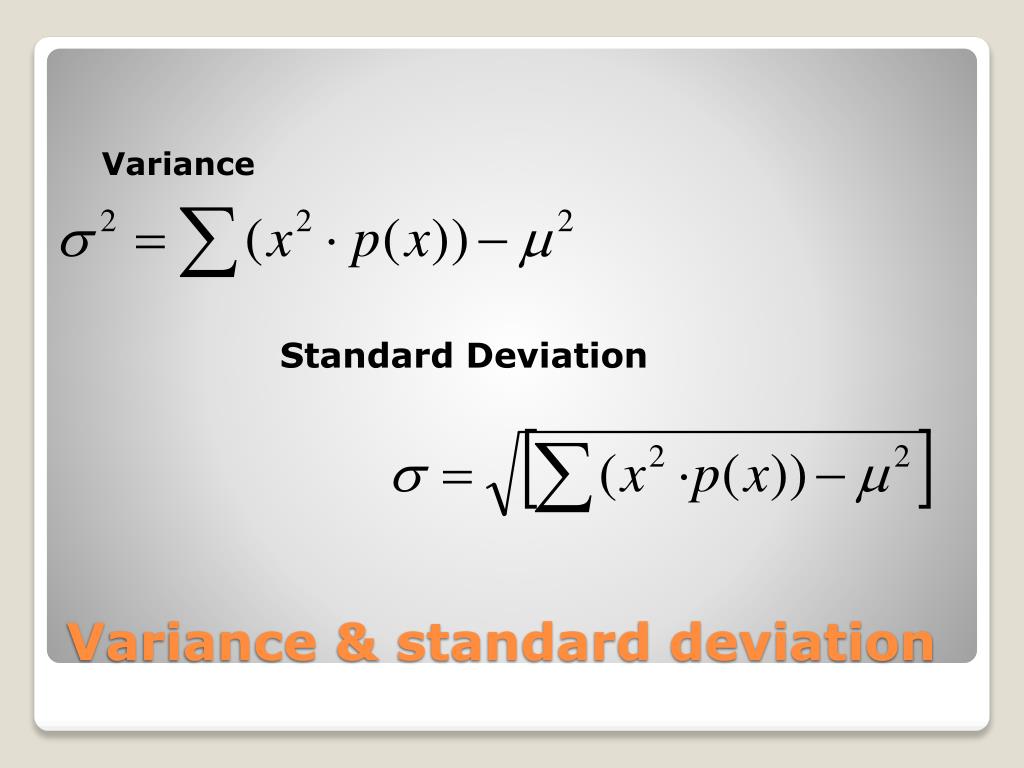
Standard deviation is a statistical measure that plays a vital role in investment analysis, as it helps investors understand the volatility of an investment’s returns. In essence, standard deviation measures the dispersion of an investment’s returns from its mean return, providing insight into the level of risk involved. A higher standard deviation indicates a higher level of volatility, while a lower standard deviation suggests a more stable investment. To calculate standard deviation, investors can use the following formula: σ = √(Σ(xi – μ)^2 / (n – 1)), where σ is the standard deviation, xi is each data point, μ is the mean, and n is the number of data points. For example, if an investment has a mean return of 10% with a standard deviation of 5%, it means that the investment’s returns are likely to fluctuate between 5% and 15%. By understanding standard deviation, investors can better assess the risk associated with an investment and make more informed decisions.
How to Calculate Expected Return: A Step-by-Step Guide
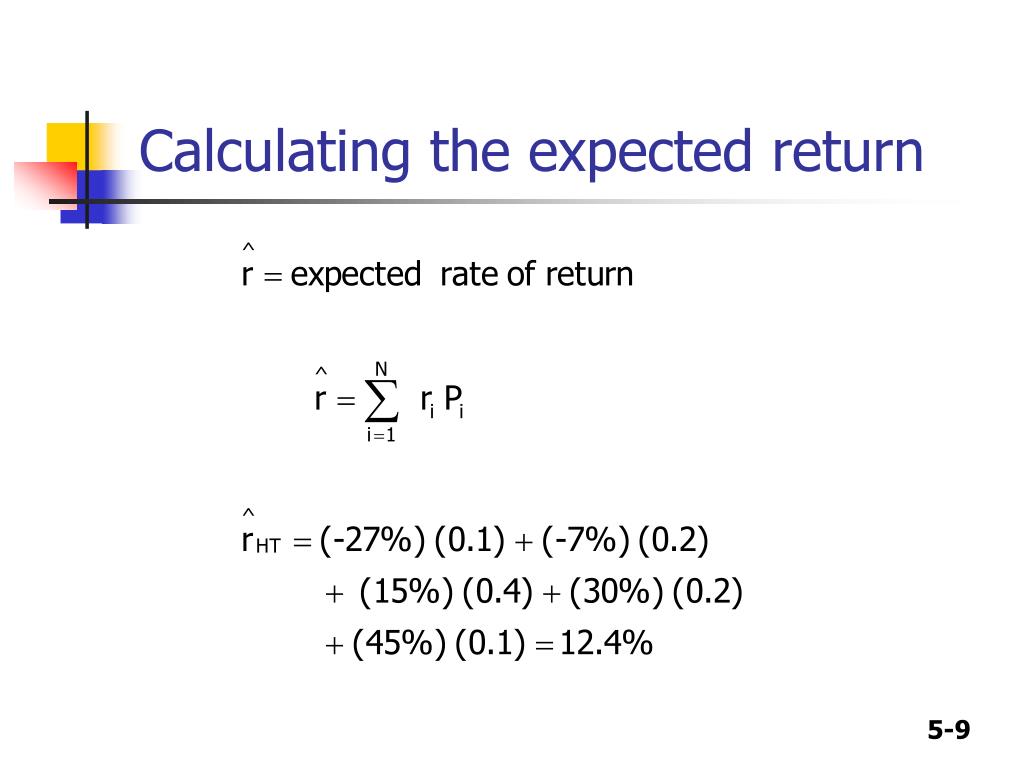
Expected return is a crucial concept in investment analysis, as it represents the anticipated return on investment based on its historical performance. Calculating expected return is a straightforward process that involves understanding the probability of different outcomes and their corresponding returns. The formula to calculate expected return is: E(R) = Σ[P(i) x R(i)], where E(R) is the expected return, P(i) is the probability of each outcome, and R(i) is the return corresponding to each outcome. To illustrate
The Relationship Between Standard Deviation and Expected Return
The relationship between standard deviation and expected return is a fundamental concept in investment analysis. In essence, there is an inverse relationship between the two, meaning that higher returns often come with higher risk, and vice versa. This relationship is rooted in the idea that investors demand higher returns for taking on greater risk. As a result, investments with higher standard deviations, indicating greater volatility, typically offer higher expected returns to compensate for the increased risk. Conversely, investments with lower standard deviations, indicating lower volatility, typically offer lower expected returns. This relationship is crucial for investors, as it allows them to make informed decisions about their investment portfolios. By understanding the tradeoff between standard deviation and expected return, investors can optimize their portfolios to achieve their desired level of risk and potential returns. For instance, an investor seeking high returns may be willing to accept a higher standard deviation, while a risk-averse investor may prioritize a lower standard deviation and accept lower expected returns. By grasping the intricate relationship between standard deviation and expected return, investors can make more informed decisions and ultimately achieve their investment goals.
Using Standard Deviation to Manage Investment Risk
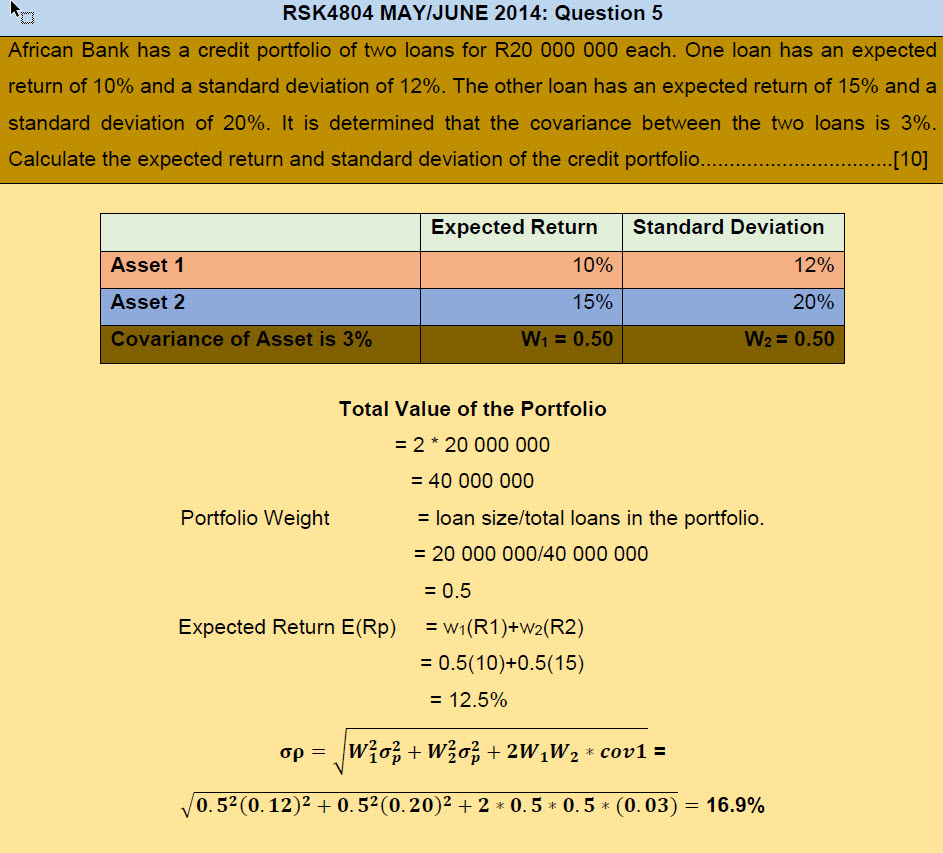
Standard deviation is a powerful tool for managing investment risk. By understanding the volatility of an investment’s returns, investors can make informed decisions to minimize risk and maximize returns. One effective way to manage risk is through diversification. By spreading investments across different asset classes, sectors, or geographic regions, investors can reduce their exposure to any one particular investment. This can help to lower the overall standard deviation of the portfolio, reducing the risk of significant losses. Another strategy is portfolio optimization, which involves allocating assets in a way that minimizes risk while maximizing expected returns. This can be achieved through techniques such as mean-variance optimization, which seeks to find the optimal balance between risk and return. Additionally, investors can use standard deviation to set risk thresholds, ensuring that their investments remain within a comfortable level of volatility. For example, an investor may set a maximum standard deviation of 10% for their portfolio, and adjust their investments accordingly. By using standard deviation to manage investment risk, investors can create a more stable and predictable investment portfolio, ultimately achieving their long-term financial goals. By combining standard deviation with expected return, investors can make more informed decisions and optimize their investment strategy to achieve the best possible outcomes.
Real-World Examples of Standard Deviation and Expected Return
In the world of investment analysis, standard deviation and expected return are not just theoretical concepts, but powerful tools used by successful investors and portfolio managers. For instance, Warren Buffett, one of the most successful investors in history, has long emphasized the importance of understanding standard deviation and expected return in his investment decisions. By carefully evaluating the volatility of his investments and their potential returns, Buffett has been able to build a portfolio that has consistently outperformed the market. Another example is David Swensen, the renowned portfolio manager of Yale University’s endowment fund. Swensen has used standard deviation and expected return to create a diversified portfolio that has generated impressive returns while minimizing risk. In addition, many institutional investors, such as pension funds and hedge funds, rely heavily on standard deviation and expected return to make informed investment decisions. By examining the standard deviation and expected return of different asset classes, these investors can create a balanced portfolio that meets their investment objectives. These real-world examples demonstrate the importance of understanding standard deviation and expected return in investment analysis, and highlight the potential for investors to achieve their financial goals by using these powerful tools.
Common Mistakes to Avoid When Using Standard Deviation and Expected Return
While standard deviation and expected return are powerful tools for investment analysis, they can also be misused or misinterpreted, leading to suboptimal investment decisions. One common mistake is to focus solely on expected return, ignoring the risk associated with an investment. This can lead to a portfolio that is overly concentrated in high-risk assets, increasing the likelihood of significant losses. Another mistake is to misinterpret standard deviation, assuming that a higher standard deviation always means higher risk. However, standard deviation only measures volatility, not the direction of returns. A high standard deviation can also indicate high potential returns. Additionally, investors may ignore other risk factors, such as correlation and skewness, which can also impact investment performance. Furthermore, investors may rely too heavily on historical data, failing to account for changes in market conditions or unexpected events. By being aware of these common mistakes, investors can avoid pitfalls and use standard deviation and expected return to make more informed, data-driven investment decisions. By combining these metrics with a deep understanding of the investment landscape, investors can create a portfolio that balances risk and return, ultimately achieving their long-term financial goals.
Maximizing Returns While Minimizing Risk: Best Practices
To maximize returns while minimizing risk, investors should adopt a disciplined approach to investment analysis, incorporating standard deviation and expected return into their decision-making process. One key best practice is to diversify a portfolio across different asset classes, sectors, and geographic regions, reducing exposure to any one particular risk factor. Additionally, investors should regularly rebalance their portfolios to maintain an optimal risk-return profile. Another important strategy is to use standard deviation to set realistic return expectations, avoiding overconfidence in high-return investments and recognizing the potential for losses. Furthermore, investors should consider using alternative risk metrics, such as value-at-risk (VaR) and conditional value-at-risk (CVaR), to gain a more comprehensive understanding of their portfolio’s risk profile. By combining these best practices with a deep understanding of standard deviation and expected return, investors can create a balanced portfolio that aligns with their investment objectives and risk tolerance. Ultimately, by mastering the art of risk management, investors can unlock the full potential of their investments, achieving long-term financial success while minimizing the risk of significant losses. By incorporating standard deviation and expected return into their investment strategy, investors can make more informed, data-driven decisions, ultimately achieving their financial goals.


:max_bytes(150000):strip_icc()/Standard-Deviation-ADD-SOURCE-e838b9dcfb89406e836ccad58278f4cd.jpg)


