What is a Skewed Distribution and Why Does it Matter?
In data analysis, understanding the characteristics of a distribution is crucial for making informed decisions. One such characteristic is skewness, which refers to the asymmetry of a distribution. A skewed distribution is one that deviates from the normal bell-curve shape, where the majority of the data points are clustered around the mean. Instead, a skewed distribution has a longer tail on one side, indicating that the data points are not evenly distributed. This concept is essential in data analysis, as it can significantly impact the accuracy of statistical models and interpretations. In particular, understanding the differences between positive vs negative skewed distributions is vital, as it can influence the choice of statistical methods and the validity of results. By grasping the fundamentals of skewed distributions, data analysts can make more informed decisions and drive better business outcomes.
Identifying Positive Skewness: Characteristics and Real-World Examples
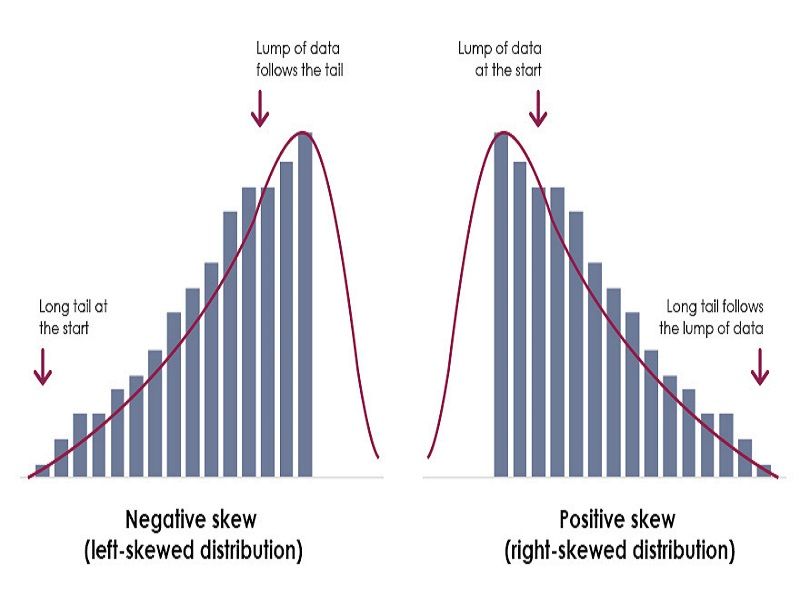
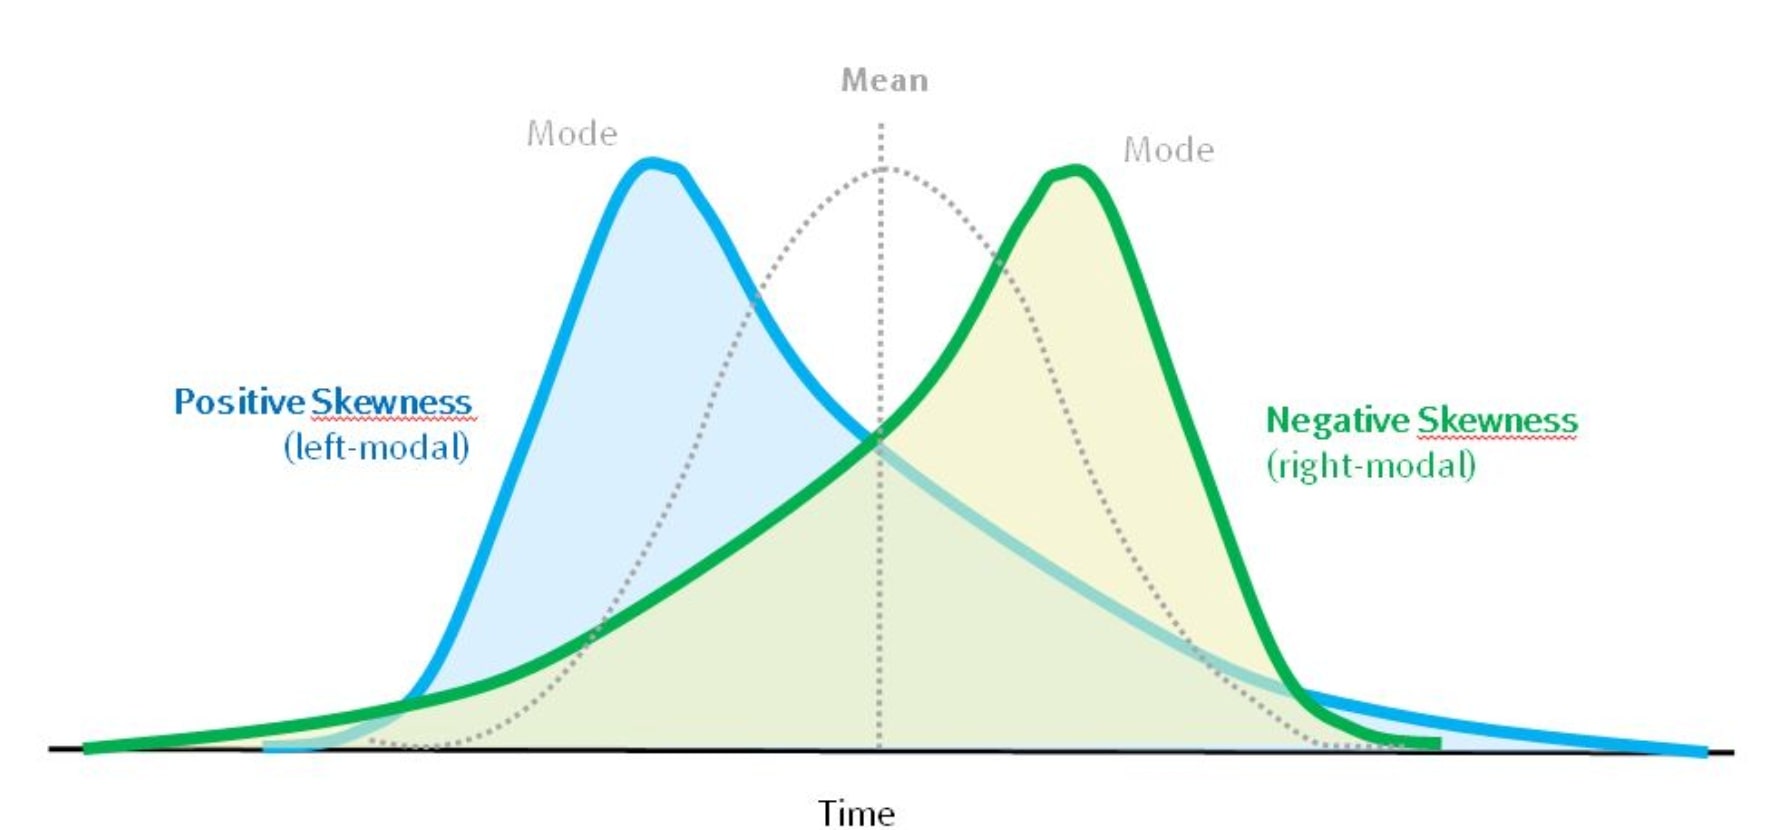
A positively skewed distribution is characterized by an asymmetrical shape, with a long tail on the right side. This means that the majority of the data points are clustered on the left side of the mean, while a smaller number of extreme values are scattered on the right side. In a positively skewed distribution, the mean is typically greater than the mode, and the median is often closer to the mode than the mean. Real-world examples of positively skewed distributions include income distribution, where a small percentage of individuals earn significantly more than the majority, and stock prices, which can experience sudden and extreme increases in value. Understanding positive skewness is essential in data analysis, as it can significantly impact the accuracy of statistical models and interpretations, particularly when comparing positive vs negative skewed distributions.
How to Recognize Negative Skewness: A Closer Look
A negatively skewed distribution is characterized by an asymmetrical shape, with a long tail on the left side. This means that the majority of the data points are clustered on the right side of the mean, while a smaller number of extreme values are scattered on the left side. In a negatively skewed distribution, the mean is typically less than the mode, and the median is often closer to the mean than the mode. Real-world examples of negatively skewed distributions include exam scores, where a small percentage of students score very low, and temperatures, which can experience sudden and extreme drops. Understanding negative skewness is crucial in data analysis, as it can significantly impact the accuracy of statistical models and interpretations, particularly when comparing positive vs negative skewed distributions. By recognizing the characteristics of negatively skewed distributions, data analysts can better understand the underlying patterns and trends in their data, and make more informed decisions.
The Impact of Skewness on Statistical Analysis and Modeling
Skewness can have a profound impact on statistical analysis and modeling, as it can significantly affect the accuracy and reliability of results. In traditional statistical methods, skewness can lead to biased estimates and incorrect conclusions, particularly when using parametric tests that assume normality. For instance, in a positively skewed distribution, the mean may be pulled upwards by extreme values, leading to an overestimation of the true population mean. Similarly, in a negatively skewed distribution, the mean may be pulled downwards, resulting in an underestimation of the true population mean. To mitigate these effects, data transformation techniques, such as logarithmic or square root transformations, can be employed to normalize the data and reduce skewness. However, it is essential to recognize that skewness is not always a problem to be solved, as it can provide valuable insights into the underlying patterns and trends in the data. By understanding the impact of skewness on statistical analysis and modeling, data analysts can make more informed decisions and develop more accurate models, particularly when working with positive vs negative skewed distributions.
Visualizing Skewed Data: The Role of Histograms and Density Plots
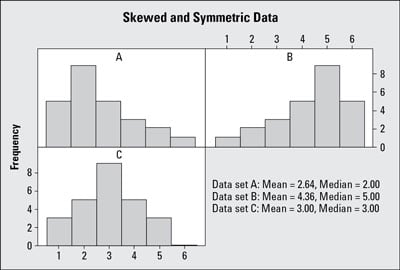
Visualizing skewed data is crucial to understanding the underlying patterns and distributions. Histograms and density plots are two essential tools in the data analyst’s toolkit, allowing them to effectively visualize and communicate the characteristics of skewed data. Histograms provide a graphical representation of the data, highlighting the asymmetrical shape and long tail of skewed distributions. Density plots, on the other hand, offer a more detailed view of the data, revealing the underlying probability distribution and providing insights into the shape and spread of the data. By using these visualization tools, data analysts can identify positive vs negative skewed distributions, recognize outliers and anomalies, and develop a deeper understanding of the data. This, in turn, enables them to make more informed decisions, develop more accurate models, and communicate their findings more effectively. Effective visualization of skewed data is essential in a wide range of fields, including business, finance, and healthcare, where accurate analysis and interpretation of data can have a significant impact on decision-making and outcomes.
Comparing Positive and Negative Skewness: Key Differences and Similarities
When working with skewed distributions, it is essential to understand the key differences and similarities between positive and negative skewness. Both types of skewness exhibit asymmetrical shapes, but they differ in the direction of the skew. Positive skewed distributions have a long tail on the right side, indicating that the majority of the data points are concentrated on the left side of the mean, with a few extreme values on the right side. In contrast, negatively skewed distributions have a long tail on the left side, indicating that the majority of the data points are concentrated on the right side of the mean, with a few extreme values on the left side. Despite these differences, both positive and negative skewed distributions can have a significant impact on statistical analysis and modeling, highlighting the importance of understanding and addressing skewness in data analysis. By recognizing the characteristics of positive vs negative skewed distributions, data analysts can develop more accurate models, make more informed decisions, and uncover hidden patterns and trends in the data.
Practical Applications of Skewed Distributions in Business and Finance
In business and finance, understanding skewed distributions is crucial for making informed decisions and managing risk. For instance, in investment analysis, positively skewed distributions can indicate high returns with low probability, while negatively skewed distributions can indicate low returns with high probability. By recognizing these patterns, investors can adjust their portfolios to minimize risk and maximize returns. In risk management, skewed distributions can help identify potential outliers and anomalies, enabling companies to develop targeted strategies to mitigate potential losses. Additionally, skewed distributions can inform forecasting models, allowing businesses to better predict demand and adjust their operations accordingly. In finance, skewed distributions can also be used to model credit risk, insurance claims, and other financial phenomena. By applying the concepts of positive vs negative skewed distributions, businesses and financial institutions can gain a competitive edge, make more accurate predictions, and drive growth.
Mastering Skewed Distributions: Tips and Best Practices for Data Analysts
When working with skewed distributions, data analysts must employ specialized techniques to uncover hidden patterns and trends. To master skewed distributions, it is essential to develop a deep understanding of positive vs negative skewed distributions and their characteristics. Here are some tips and best practices for data analysts: First, always visualize the data using histograms and density plots to identify skewness. Next, apply data transformation techniques, such as logarithmic or square root transformations, to normalize the data. When modeling skewed data, consider using robust regression methods or machine learning algorithms that can handle non-normality. Additionally, be aware of the limitations of traditional statistical methods and consider alternative approaches, such as non-parametric tests or Bayesian analysis. By following these best practices, data analysts can unlock the secrets of skewed distributions and make more accurate predictions, drive business growth, and inform strategic decision-making.


:max_bytes(150000):strip_icc()/Skewness2-866dfeb82de440aea40aed9eb6e59e57.jpg)