What is Skewness in Statistics?
In statistics, skewness is a measure of the asymmetry of a probability distribution. It is a crucial concept in understanding the behavior of data, as it can significantly impact the accuracy of statistical models and conclusions. Skewness can be either positive or negative, and understanding the differences between these two types is essential for making informed decisions in various fields, including finance and economics. For instance, in finance, skewness can affect the risk assessment of investments, while in economics, it can influence the analysis of economic indicators. In this article, we will delve into the world of skewness, exploring the concept of positive skew vs negative skew and its practical applications.

Click Image to Find Quantum Products

Understanding Positive Skew: The Right-Tailed Distribution
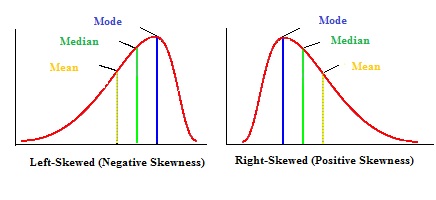
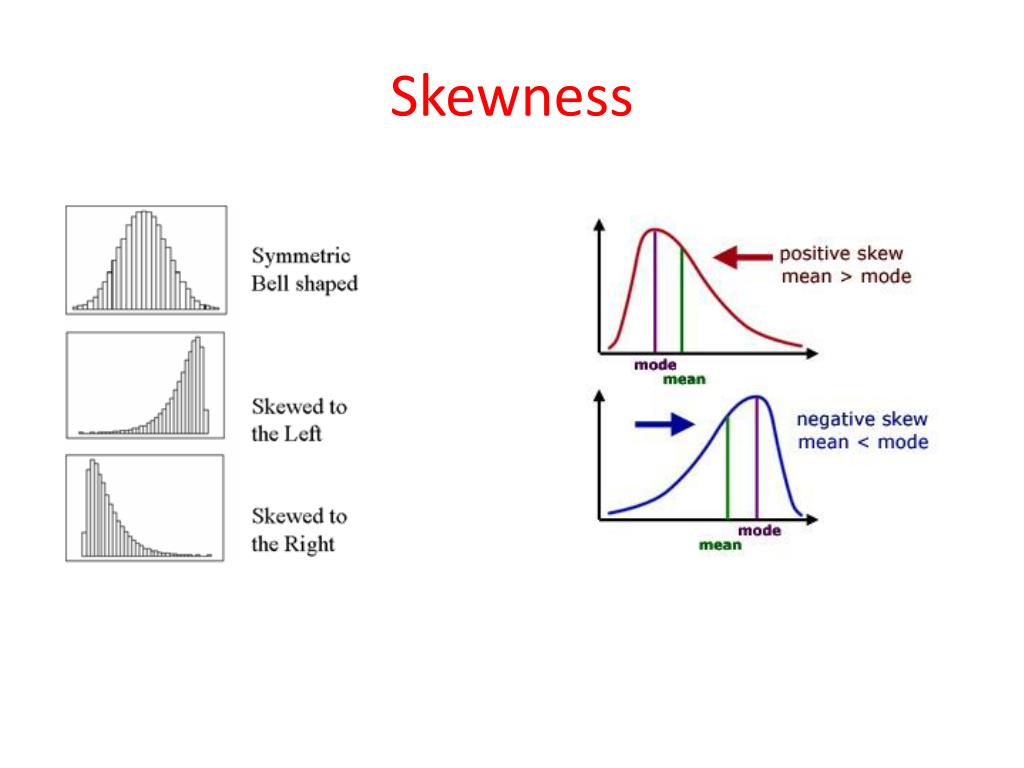
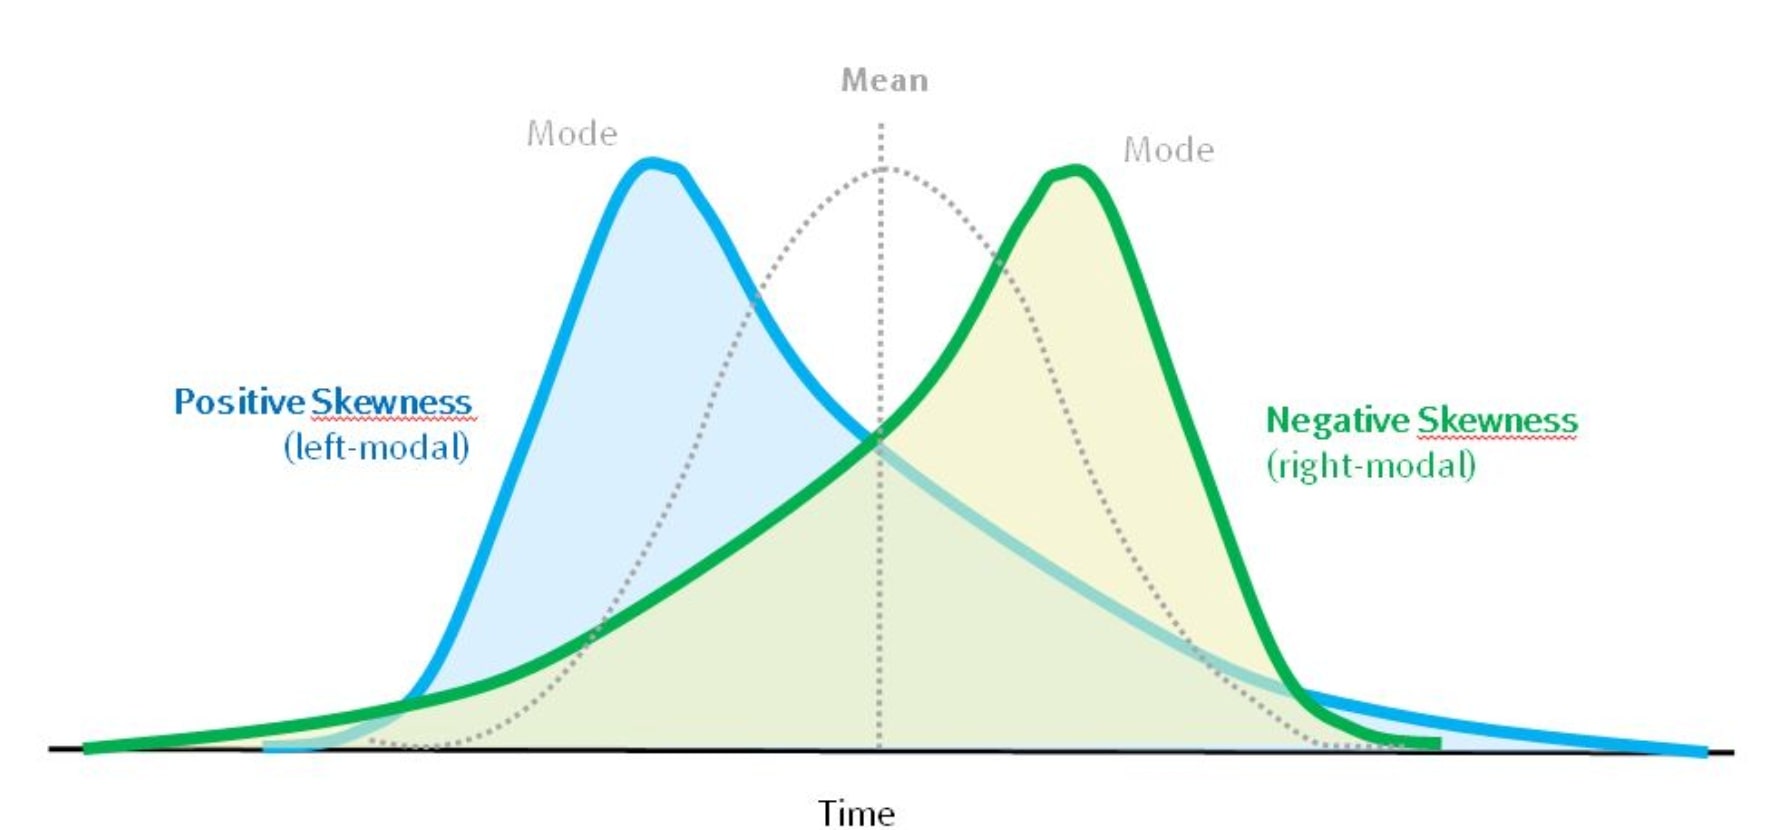
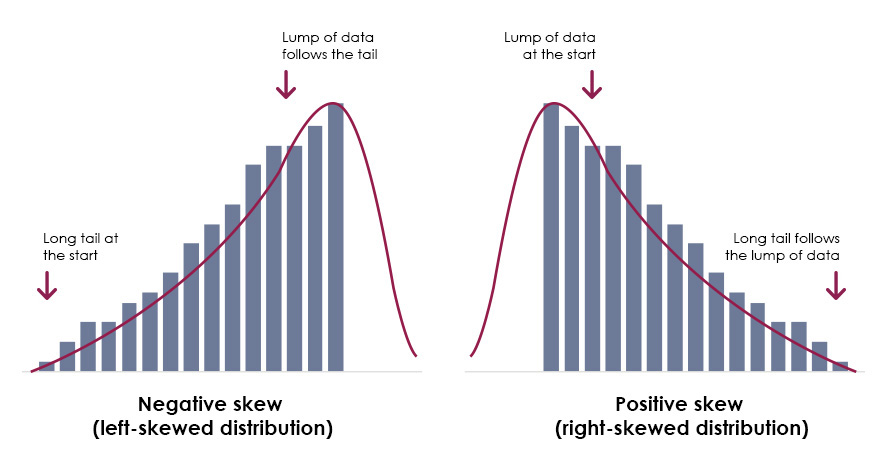
A positive skew, also known as a right-skewed distribution, is a type of asymmetrical distribution where the majority of the data points are concentrated on the left side of the mean, with a long tail of extreme values on the right side. This type of distribution is commonly observed in datasets that contain outliers or extreme values, such as stock prices, income levels, or medical test results. In a positively skewed distribution, the mean is typically greater than the median, and the mode is often the smallest of the three. Visualizing a positively skewed distribution using histograms or density plots can help identify the characteristic right-tailed shape, which is essential for accurate data analysis and modeling. Understanding positive skew vs negative skew is crucial in making informed decisions in various fields, including finance and economics.
:max_bytes(150000):strip_icc()/Skewness2-866dfeb82de440aea40aed9eb6e59e57.jpg)
How to Identify Positive Skew in Your Data
Identifying positive skew in a dataset is crucial for accurate data analysis and modeling. There are several graphical and numerical techniques that can help detect positive skew. One common method is to create a histogram or density plot of the data, which can reveal the characteristic right-tailed shape of a positively skewed distribution. Another approach is to calculate the skewness coefficient, which measures the degree of asymmetry in the data. A skewness coefficient greater than zero indicates positive skew, while a coefficient less than zero indicates negative skew. Additionally, statistical tests such as the Jarque-Bera test can be used to determine if the data follows a normal distribution or if it exhibits skewness. Understanding how to identify positive skew vs negative skew is essential in making informed decisions in various fields, including finance and economics. For instance, in finance, identifying positive skew in stock prices can help investors make informed investment decisions. In economics, understanding skewness can help policymakers develop more effective economic models.
The Consequences of Ignoring Positive Skew
Ignoring positive skew in data analysis can have severe consequences, leading to inaccurate conclusions and poor decision-making. When data is positively skewed, traditional statistical methods that assume normality may not be applicable, and using them can result in misleading results. For instance, in finance, ignoring positive skew in stock prices can lead to underestimation of risk, resulting in poor investment decisions. In healthcare, failing to account for positive skew in medical test results can lead to misdiagnosis and ineffective treatment. Moreover, ignoring positive skew can also lead to biased models, which can perpetuate existing inequalities and reinforce harmful stereotypes. Understanding the differences between positive skew vs negative skew is crucial in avoiding these consequences and making informed decisions. By acknowledging and addressing positive skew, data analysts and decision-makers can ensure that their conclusions are accurate and reliable, and that their decisions are informed by a deep understanding of the data.
Negative Skew: The Left-Tailed Distribution
Negative skew, also known as left-skewed or skewed to the left, is a type of asymmetry in a probability distribution. In a negatively skewed distribution, the majority of the data points are concentrated on the right side of the mean, with a long tail of extreme values on the left side. This type of distribution is commonly observed in datasets where the values are bounded on the right, such as exam scores or stock prices. Understanding negative skew is essential in data analysis, as it can have significant implications for statistical modeling and decision-making. For instance, in finance, negative skew in stock prices can indicate a higher risk of losses, while in healthcare, negative skew in medical test results can indicate a higher risk of misdiagnosis. By recognizing the differences between positive skew vs negative skew, data analysts can develop more accurate models and make more informed decisions. Visual aids, such as histograms and density plots, can help illustrate the concept of negative skew and facilitate a deeper understanding of the data.

Key Differences Between Positive and Negative Skew
Understanding the differences between positive skew and negative skew is crucial in data analysis, as it can significantly impact the accuracy of statistical models and decision-making. While both types of skewness indicate asymmetry in a probability distribution, they have distinct characteristics and implications. Positive skew, characterized by a right-tailed distribution, is often observed in datasets with extreme values on the right side of the mean, such as stock prices or income levels. In contrast, negative skew, characterized by a left-tailed distribution, is often observed in datasets with extreme values on the left side of the mean, such as exam scores or medical test results. One of the key differences between positive skew vs negative skew is the direction of the tail, which can have significant implications for risk assessment and decision-making. For instance, in finance, positive skew may indicate a higher risk of extreme gains, while negative skew may indicate a higher risk of extreme losses. By recognizing these differences, data analysts can develop more accurate models and make more informed decisions. Additionally, understanding the differences between positive and negative skew can also help identify potential biases in data collection and analysis, leading to more robust and reliable results.
Real-World Applications of Skewness
Skewness has far-reaching implications in various fields, including finance, economics, and healthcare. In finance, understanding skewness is crucial for risk assessment and portfolio management. For instance, a positively skewed distribution of stock prices may indicate a higher risk of extreme gains, while a negatively skewed distribution may indicate a higher risk of extreme losses. By recognizing the differences between positive skew vs negative skew, financial analysts can develop more accurate models and make more informed investment decisions. In economics, skewness is essential for understanding income inequality and poverty rates. A negatively skewed distribution of income levels may indicate a higher proportion of low-income households, while a positively skewed distribution may indicate a higher proportion of high-income households. In healthcare, skewness is critical for understanding the distribution of medical test results and disease prevalence. A positively skewed distribution of test results may indicate a higher risk of false positives, while a negatively skewed distribution may indicate a higher risk of false negatives. By considering skewness in data analysis, healthcare professionals can develop more accurate diagnostic models and improve patient outcomes. In all these fields, understanding skewness is essential for making informed decisions and driving business success.
Mastering Skewness: Best Practices for Data Analysis
Working with skewed data requires a range of specialized techniques to ensure accurate analysis and modeling. One of the most effective strategies is data transformation, which involves applying mathematical functions to normalize the data and reduce skewness. For instance, logarithmic transformations can be used to stabilize variance and reduce positive skew, while square root transformations can be used to reduce negative skew. Another key technique is data visualization, which involves using plots and charts to identify patterns and outliers in the data. By visualizing the data, analysts can quickly identify skewness and develop targeted strategies for addressing it. In addition, modeling techniques such as robust regression and generalized linear models can be used to accommodate skewness and improve the accuracy of statistical models. By mastering these best practices, data analysts can unlock the power of skewed data and drive business success. For example, in finance, understanding positive skew vs negative skew can help analysts develop more accurate models of stock prices and portfolio risk. By applying these best practices, analysts can improve the accuracy of their models and make more informed investment decisions. Similarly, in healthcare, understanding skewness can help analysts develop more accurate models of disease prevalence and treatment outcomes. By applying these best practices, analysts can improve the accuracy of their models and drive better patient outcomes.