What is the PE Ratio and Why Does it Matter?
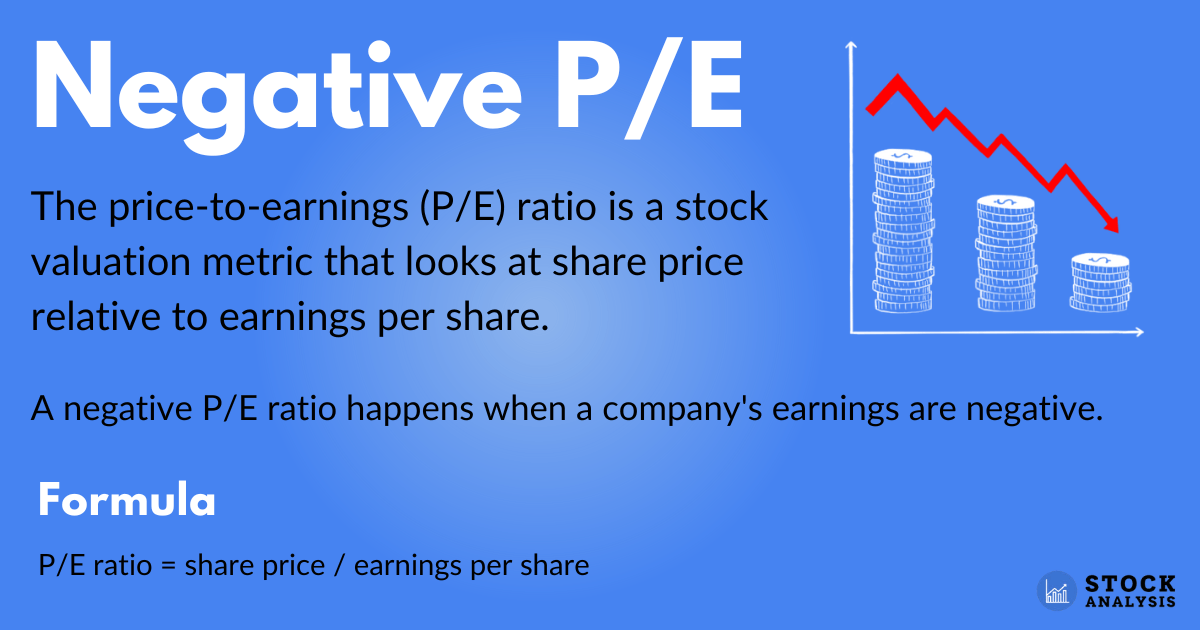
The Price-to-Earnings (PE) ratio is a fundamental metric in stock valuation, providing investors with a snapshot of a company’s current market value relative to its earnings. In the context of the S&P 500, the PE ratio serves as a benchmark for the broader market, offering insights into investor sentiment and market trends. Calculated by dividing the current stock price by earnings per share, the PE ratio helps investors determine whether a stock is overvalued or undervalued. A higher PE ratio may indicate that investors have high expectations for a company’s future growth, while a lower PE ratio may suggest that the stock is undervalued. By understanding the PE ratio of S&P 500 companies, investors can make more informed decisions, identifying potential opportunities and avoiding costly mistakes. In essence, the PE ratio is a powerful tool for investors seeking to navigate the complexities of the stock market.

Click Image to Find Quantum Products
How to Analyze the PE Ratio of S&P 500 Companies
To effectively analyze the PE ratio of S&P 500 companies, investors should follow a step-by-step approach. First, calculate the PE ratio by dividing the current stock price by earnings per share. Next, consider the industry average PE ratio to determine if the company’s PE ratio is relatively high or low. Historical trends should also be examined to identify patterns and potential shifts in investor sentiment. Additionally, investors should analyze the PE ratio in conjunction with other valuation metrics, such as the Price-to-Book (PB) ratio and the Dividend Yield, to gain a more comprehensive understanding of the company’s value. By following this approach, investors can gain valuable insights into the PE ratio of S&P 500 companies, enabling them to make more informed investment decisions. For instance, a company with a high PE ratio compared to its industry average may indicate that investors have high expectations for its future growth, while a low PE ratio may suggest that the stock is undervalued. By understanding the PE ratio of S&P 500 companies, investors can identify potential opportunities and avoid costly mistakes.

A Deep Dive into the PE Ratios of S&P 500 Companies
A comprehensive analysis of the PE ratios of S&P 500 companies reveals a complex landscape of sector-wise trends, industry leaders, and outliers. The technology sector, for instance, tends to have higher PE ratios due to its high growth potential, with companies like Amazon and Microsoft boasting PE ratios above 30. In contrast, the energy sector typically has lower PE ratios, reflecting the cyclical nature of the industry. Industry leaders like Johnson & Johnson and Procter & Gamble have consistently high PE ratios, indicating investor confidence in their ability to generate stable earnings. On the other hand, outliers like Tesla and Netflix have PE ratios that are significantly higher than their industry averages, suggesting that investors have high expectations for their future growth. By examining the PE ratios of S&P 500 companies, investors can gain a deeper understanding of the market’s expectations and identify potential opportunities for investment. For example, a company with a low PE ratio compared to its industry average may indicate that the stock is undervalued, while a company with a high PE ratio may suggest that investors have high expectations for its future growth. By analyzing the PE ratio of S&P 500 companies, investors can make more informed decisions and optimize their investment strategy.

What Do PE Ratios Reveal About the Market?
The PE ratio of S&P 500 companies provides valuable insights into market sentiment, economic conditions, and investor expectations. A high PE ratio, for instance, may indicate that investors are optimistic about the market’s future growth prospects, while a low PE ratio may suggest caution or uncertainty. By analyzing the PE ratio of S&P 500 companies, investors can gain a better understanding of the market’s mood and make more informed investment decisions. For example, during times of economic uncertainty, investors may flock to defensive sectors with lower PE ratios, such as consumer staples or healthcare, seeking stability and predictability. In contrast, during periods of economic growth, investors may be more willing to take on risk and invest in sectors with higher PE ratios, such as technology or finance. The PE ratio of S&P 500 companies can also reveal trends and patterns in investor behavior, such as the shift towards value investing or the increasing popularity of dividend-paying stocks. By examining the PE ratio of S&P 500 companies, investors can stay ahead of the curve and adapt their investment strategy to changing market conditions.

Comparing PE Ratios Across Sectors and Industries
A closer examination of the PE ratios of different sectors and industries within the S&P 500 reveals a complex landscape of trends, patterns, and potential opportunities. The technology sector, for instance, tends to have higher PE ratios due to its high growth potential, with companies like Amazon and Microsoft boasting PE ratios above 30. In contrast, the energy sector typically has lower PE ratios, reflecting the cyclical nature of the industry. The healthcare sector, meanwhile, has a mix of high and low PE ratios, depending on the specific industry sub-group, such as pharmaceuticals or medical devices. By comparing the PE ratios of different sectors and industries, investors can identify areas of the market that may be undervalued or overvalued, and adjust their investment strategy accordingly. For example, an investor may find that the PE ratio of the financial sector is lower than its historical average, indicating a potential buying opportunity. Alternatively, an investor may identify a sector with a high PE ratio, such as technology, and decide to allocate a smaller portion of their portfolio to that sector. By examining the PE ratio of S&P 500 companies across different sectors and industries, investors can gain a deeper understanding of the market and make more informed investment decisions.

Identifying Undervalued and Overvalued Stocks Using PE Ratios
One of the most practical applications of the PE ratio of S&P 500 companies is identifying undervalued and overvalued stocks. By comparing a company’s PE ratio to its industry average, sector average, or historical average, investors can determine if the stock is reasonably priced or not. For instance, if a company’s PE ratio is significantly lower than its industry average, it may be undervalued and worth further investigation. On the other hand, if a company’s PE ratio is significantly higher than its industry average, it may be overvalued and due for a correction. To illustrate this concept, let’s consider a real-world example. Suppose we’re analyzing the PE ratio of Coca-Cola, a well-established company in the consumer staples sector. If we find that Coca-Cola’s PE ratio is 20, which is lower than the sector average of 25, we may conclude that the stock is undervalued and consider adding it to our portfolio. Conversely, if we find that a company like Tesla has a PE ratio of 100, which is significantly higher than the industry average of 30, we may conclude that the stock is overvalued and avoid it. By using the PE ratio of S&P 500 companies to identify undervalued and overvalued stocks, investors can make more informed investment decisions and potentially generate higher returns.

The Limitations of PE Ratios: What Else to Consider
While the PE ratio of S&P 500 companies is a valuable tool for investors, it is essential to recognize its limitations. Relying solely on PE ratios can lead to a narrow and incomplete view of a company’s valuation. For instance, the PE ratio does not take into account the company’s debt levels, cash flow, or dividend yield, which can significantly impact its overall valuation. Furthermore, the PE ratio is sensitive to changes in earnings, which can be volatile and influenced by various factors, such as economic conditions, industry trends, and company-specific events. To gain a more comprehensive understanding of a company’s valuation, investors should consider other valuation metrics, such as the Price-to-Book (PB) ratio, which provides insight into a company’s asset value, and the Dividend Yield, which reflects a company’s ability to generate income. Additionally, investors should analyze a company’s financial statements, management team, industry trends, and competitive landscape to form a more complete picture of its valuation. By combining the PE ratio with these other metrics and factors, investors can make more informed investment decisions and avoid potential pitfalls. For example, a company with a high PE ratio may appear overvalued, but if it has a strong track record of earnings growth, a solid balance sheet, and a competitive advantage, it may still be a good investment opportunity. By recognizing the limitations of PE ratios and incorporating other valuation metrics and factors, investors can unlock a more nuanced understanding of the PE ratio of S&P 500 companies and make more effective investment decisions.
Conclusion: Unlocking the Power of PE Ratios in Your Investment Strategy
In conclusion, the PE ratio of S&P 500 companies is a powerful tool for investors seeking to make informed investment decisions. By understanding how to calculate and interpret the PE ratio, investors can gain valuable insights into a company’s valuation and potential for growth. The PE ratio can also provide a broader understanding of market sentiment, economic conditions, and investor expectations. However, it is essential to recognize the limitations of relying solely on PE ratios and to incorporate other valuation metrics, such as the Price-to-Book (PB) ratio and the Dividend Yield, into a comprehensive investment strategy. By doing so, investors can unlock the full potential of the PE ratio and make more effective investment decisions. Whether you’re a seasoned investor or just starting out, incorporating the PE ratio of S&P 500 companies into your investment strategy can help you achieve your long-term financial goals. Remember to always consider the PE ratio in conjunction with other valuation metrics and to stay up-to-date with market trends and conditions. With the right approach, the PE ratio can be a powerful tool in your investment arsenal.