Unraveling the Mysteries of OAS and Z Spreads
Bond yield analysis is a crucial aspect of investment decision-making, and understanding the intricacies of OAS (Option-Adjusted Spread) and Z Spread is essential for evaluating bond performance. These two metrics have become indispensable tools for investors and analysts, providing valuable insights into a bond’s credit risk, liquidity, and valuation. The OAS spread vs Z spread debate has sparked intense interest among financial professionals, with each side having its unique advantages and limitations. This article aims to provide a clear comparison of OAS and Z Spread, exploring their calculations, interpretations, and applications in bond yield analysis, and empowering readers to make informed investment decisions.
What is OAS Spread: A Deep Dive into its Calculation and Interpretation
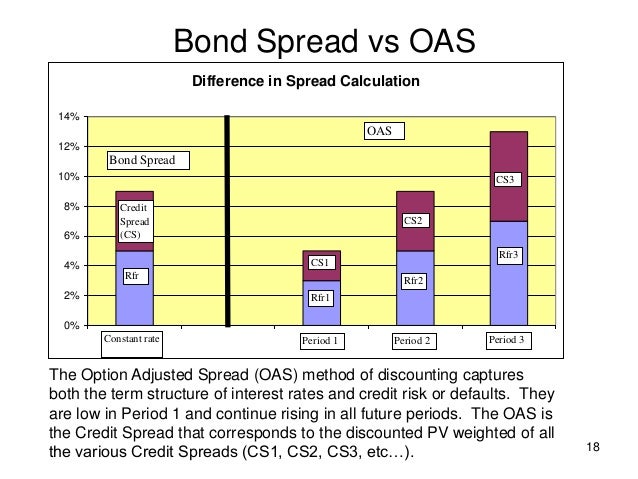
OAS (Option-Adjusted Spread) is a widely used metric in bond yield analysis that helps investors and analysts evaluate the performance of a bond. The OAS spread is calculated by adjusting the yield spread of a bond to account for the embedded options, such as callability or putability. This adjustment is crucial, as it reflects the bond’s credit risk and liquidity. The OAS spread is composed of two components: the credit spread and the liquidity spread. The credit spread represents the premium required by investors for taking on credit risk, while the liquidity spread reflects the cost of trading the bond. Understanding the OAS spread is essential in bond valuation, as it provides a more accurate picture of a bond’s yield. For instance, a bond with a higher OAS spread indicates a higher credit risk or lower liquidity, which can inform investment decisions. In the context of oas spread vs z spread, understanding the calculation and interpretation of OAS spread is vital for making informed investment decisions.
Demystifying Z Spread: Understanding its Role in Bond Valuation
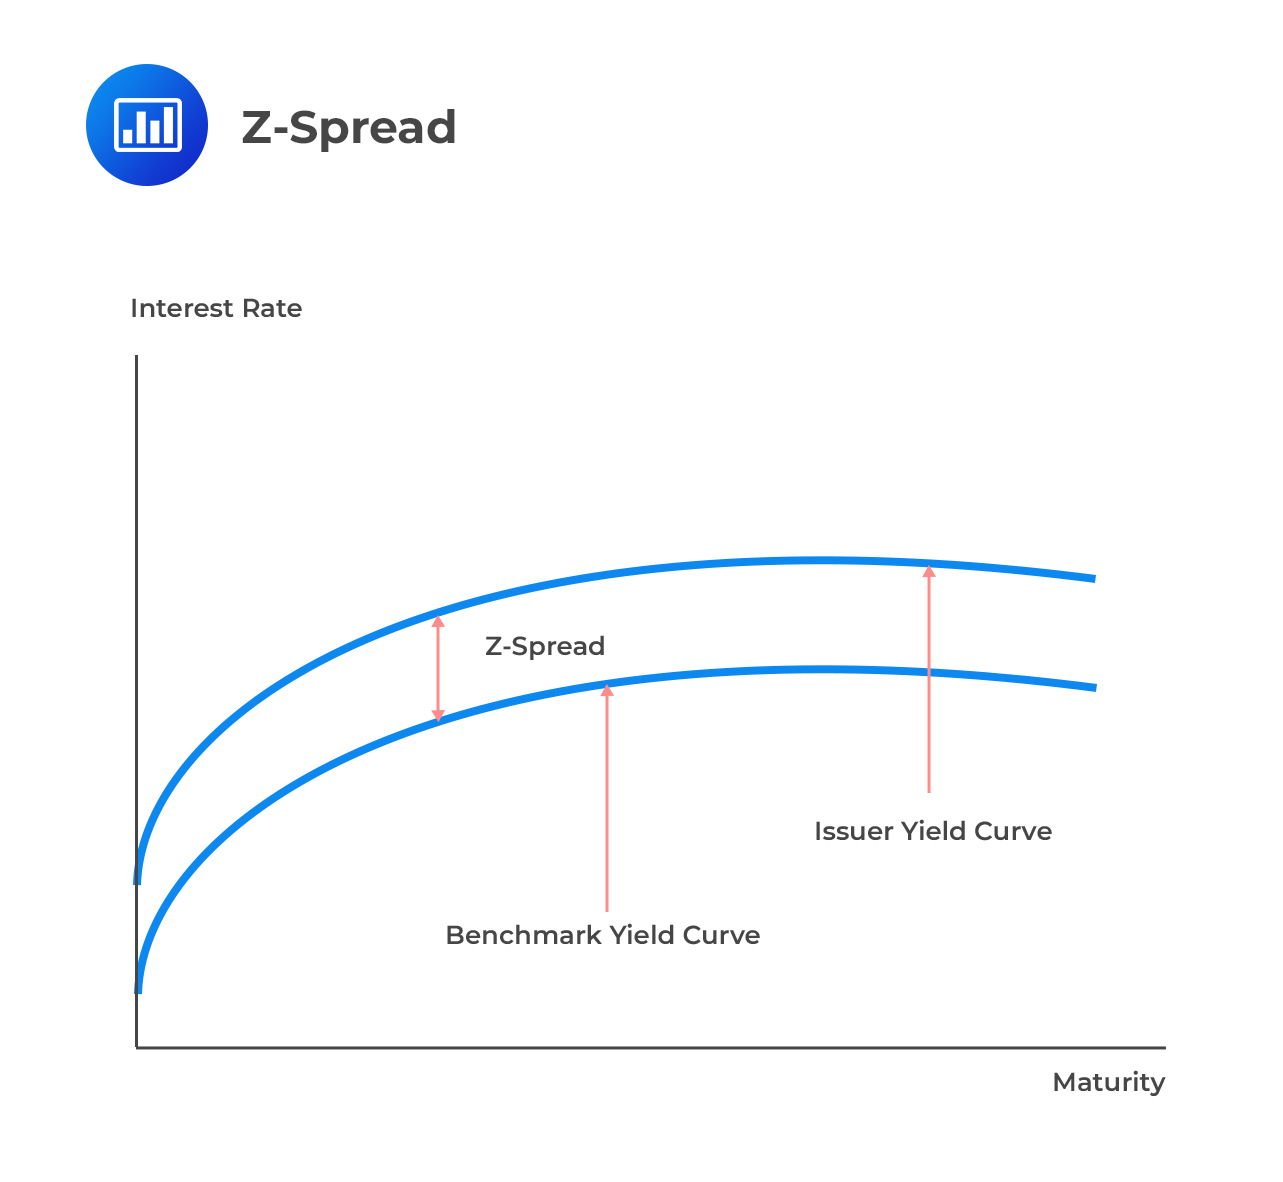
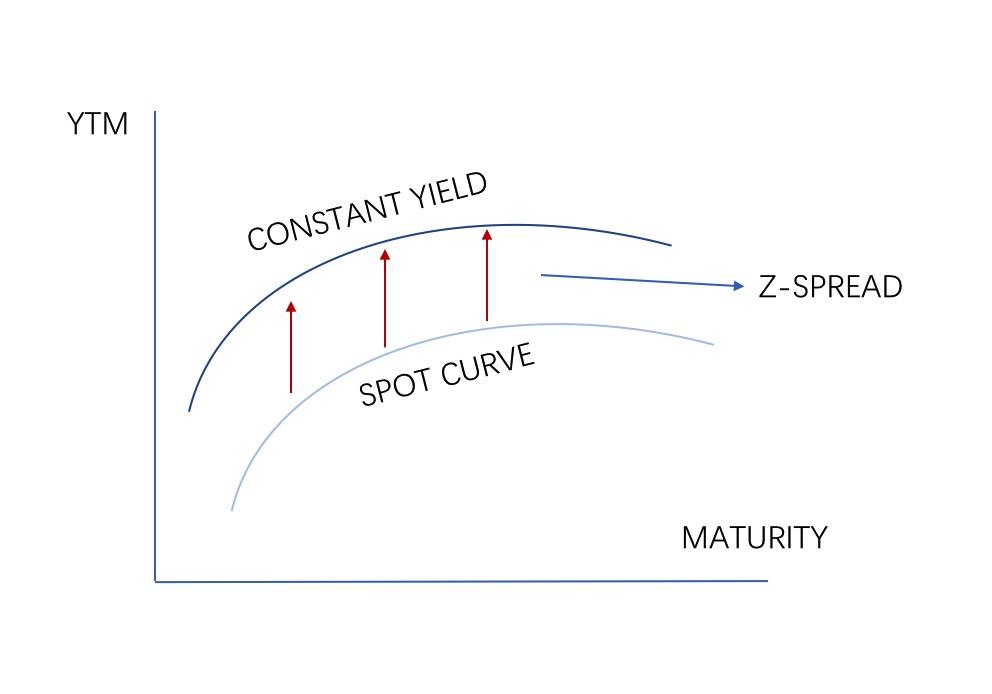
Z Spread is a widely used metric in bond yield analysis that provides a more accurate measure of a bond’s yield by adjusting for the zero-volatility spread. Unlike OAS Spread, Z Spread does not account for embedded options, making it a more straightforward calculation. The Z Spread is calculated as the difference between the bond’s yield and the yield of a comparable Treasury security. This metric is significant in bond valuation, as it helps investors and analysts assess the bond’s credit risk and liquidity. In the context of oas spread vs z spread, understanding the differences between these two metrics is crucial. For instance, Z Spread is more suitable for bonds with fewer embedded options, while OAS Spread is more applicable to bonds with complex option structures. By grasping the concept of Z Spread, investors can make more informed decisions and optimize their bond portfolios.
How to Choose Between OAS and Z Spread for Bond Analysis
When it comes to bond yield analysis, choosing the right metric is crucial. Both OAS Spread and Z Spread are valuable tools, but they serve different purposes and are suited for different bond types and market conditions. To make informed investment decisions, it’s essential to understand when to use OAS Spread and when to use Z Spread. In general, OAS Spread is more suitable for bonds with complex option structures, such as callable or putable bonds, as it accounts for the embedded options. On the other hand, Z Spread is more applicable to bonds with fewer embedded options, as it provides a more straightforward calculation. Additionally, market conditions also play a role in the choice between OAS Spread and Z Spread. In times of high volatility, OAS Spread may be more useful, as it provides a more accurate reflection of the bond’s credit risk and liquidity. In contrast, during periods of low volatility, Z Spread may be sufficient. By considering these factors, investors can choose the most appropriate metric for their bond analysis, ultimately leading to more informed investment decisions and optimized portfolios. In the context of oas spread vs z spread, understanding the strengths and weaknesses of each metric is vital for making informed investment decisions.
OAS vs Z Spread: A Side-by-Side Comparison of Key Features
When it comes to bond yield analysis, understanding the differences between OAS Spread and Z Spread is crucial. While both metrics are used to evaluate bond performance, they have distinct calculation methods, interpretations, and applications. In this section, we’ll provide a detailed comparison of OAS and Z Spread, highlighting their similarities and differences. The table below summarizes the key features of OAS Spread and Z Spread:
| Metric | Calculation | Interpretation | Application |
|---|---|---|---|
| OAS Spread | Accounts for embedded options | Reflects credit risk and liquidity | Suitable for bonds with complex option structures |
| Z Spread | Does not account for embedded options | Reflects credit risk and liquidity, but with less accuracy | Suitable for bonds with fewer embedded options |
In the context of oas spread vs z spread, understanding these differences is vital for making informed investment decisions. By recognizing the strengths and weaknesses of each metric, investors can choose the most appropriate tool for their bond analysis, ultimately leading to more accurate assessments of bond performance and optimized portfolios. In the next section, we’ll explore the real-world applications of OAS and Z Spread in bond portfolio management.
Real-World Applications of OAS and Z Spread in Bond Portfolio Management
In bond portfolio management, OAS Spread and Z Spread play critical roles in informing investment decisions and risk management strategies. By understanding the strengths and weaknesses of each metric, investors can optimize their portfolios and achieve their investment goals. Here are some real-world examples of how OAS Spread and Z Spread are used in bond portfolio management:
For instance, a fixed-income investor may use OAS Spread to evaluate the performance of a callable bond. By accounting for the embedded option, the investor can gain a more accurate understanding of the bond’s credit risk and liquidity. This information can then be used to make informed investment decisions, such as whether to hold or sell the bond.
In contrast, a portfolio manager may use Z Spread to assess the performance of a plain vanilla bond. Since Z Spread does not account for embedded options, it provides a more straightforward calculation of the bond’s credit risk and liquidity. This information can be used to make decisions about bond allocation and risk management.
In the context of oas spread vs z spread, understanding their real-world applications is crucial for making informed investment decisions. By recognizing the strengths and weaknesses of each metric, investors can choose the most appropriate tool for their bond analysis, ultimately leading to more accurate assessments of bond performance and optimized portfolios.
Furthermore, OAS Spread and Z Spread can be used in conjunction with other metrics, such as duration and convexity, to gain a more comprehensive understanding of bond risk and return. By combining these metrics, investors can develop a more nuanced understanding of their bond portfolios and make more informed investment decisions.
Common Pitfalls to Avoid When Using OAS and Z Spread
When using OAS Spread and Z Spread in bond yield analysis, it’s essential to avoid common pitfalls that can lead to inaccurate assessments and misguided investment decisions. Here are some common mistakes to watch out for:
One common pitfall is failing to account for the bond’s specific characteristics, such as its credit rating, maturity, and embedded options. This can lead to inaccurate calculations of OAS Spread and Z Spread, which can result in poor investment decisions.
Another mistake is using OAS Spread and Z Spread interchangeably, without understanding their differences in calculation and interpretation. This can lead to confusion and misapplication of the metrics, ultimately resulting in suboptimal investment decisions.
In the context of oas spread vs z spread, it’s also important to avoid relying solely on one metric or the other. Instead, investors should use a combination of OAS Spread and Z Spread, along with other metrics, to gain a more comprehensive understanding of bond risk and return.
Additionally, investors should be cautious when using OAS Spread and Z Spread in rapidly changing market conditions. In such cases, the metrics may not accurately reflect the bond’s true credit risk and liquidity, leading to poor investment decisions.
By avoiding these common pitfalls, investors can ensure that they are using OAS Spread and Z Spread effectively, and making informed investment decisions that drive portfolio performance.
Conclusion: Unlocking the Power of OAS and Z Spread in Bond Yield Analysis
In conclusion, mastering bond yield analysis requires a deep understanding of OAS Spread and Z Spread, two essential metrics used to evaluate bond performance. By grasping the nuances of oas spread vs z spread, investors can make informed investment decisions, optimize their portfolios, and mitigate risk.
This comprehensive guide has provided a clear comparison of OAS Spread and Z Spread, highlighting their similarities and differences in terms of calculation, interpretation, and application. By understanding the strengths and weaknesses of each metric, investors can choose the most appropriate tool for their bond analysis, ultimately leading to more accurate assessments of bond performance and optimized portfolios.
Whether you’re a seasoned investor or just starting to navigate the world of bond yield analysis, it’s essential to recognize the importance of OAS Spread and Z Spread in informing investment decisions and risk management strategies. By avoiding common pitfalls and misconceptions, investors can unlock the full potential of these metrics and drive portfolio performance.
In the world of bond yield analysis, oas spread vs z spread is a critical distinction that can make all the difference in investment outcomes. By mastering these metrics, investors can gain a competitive edge, optimize their portfolios, and achieve their investment goals.


