Filling in the Gaps: Understanding the Purpose of Interpolation
In data analysis, interpolation is a crucial technique used to fill in missing values in a dataset. When learning how to interpolate in Excel, it’s essential to understand the importance of interpolation in data analysis. Interpolation helps to create a more comprehensive and accurate picture of the data, enabling data analysts to make more informed decisions. By estimating missing values based on existing data, interpolation can identify patterns and trends that may not be immediately apparent. In Excel, interpolation can be used in a variety of applications, from forecasting sales to predicting stock prices. In this article, we will explore the different methods of interpolation available in Excel and provide a step-by-step guide on how to interpolate in Excel.
Choosing the Right Interpolation Method for Your Data
When it comes to how to interpolate in Excel, selecting the right interpolation method is crucial. Excel offers several interpolation methods, each with its strengths and weaknesses. Linear interpolation is a simple and intuitive method that assumes a straight-line relationship between data points. It’s ideal for datasets with a clear linear trend. Polynomial interpolation, on the other hand, is more complex and can handle non-linear relationships. It’s suitable for datasets with multiple variables and non-linear trends. Spline interpolation is a more advanced method that uses piecewise polynomials to create a smooth curve. It’s ideal for datasets with irregularly spaced data or complex relationships. When choosing an interpolation method, it’s essential to consider the nature of the data, the level of complexity, and the desired level of accuracy. By selecting the right interpolation method, data analysts can ensure that their results are reliable and accurate.
How to Interpolate in Excel: A Hands-On Tutorial
Now that we’ve discussed the importance of interpolation and the different methods available, let’s dive into a step-by-step guide on how to interpolate in Excel using the TREND function. The TREND function is a powerful tool that allows us to perform linear interpolation with ease. To get started, follow these steps:
Step 1: Prepare your data by organizing it into two columns – one for the x-values and one for the y-values.
Step 2: Select the cell where you want to display the interpolated value.
Step 3: Type “=TREND(” and select the range of y-values, followed by the range of x-values, and the x-value for which you want to interpolate.
Step 4: Press Enter to calculate the interpolated value.
For example, let’s say we have a dataset with temperatures recorded at different times of the day, and we want to interpolate the temperature at 2:30 PM. Using the TREND function, we can easily calculate the interpolated value.

By following these steps, you can easily perform linear interpolation in Excel using the TREND function. This is just the beginning of how to interpolate in Excel, and we’ll explore more advanced techniques later in this article.
Interpolating Missing Values in a Time Series
When working with time series data, it’s not uncommon to encounter missing values. This can be due to various reasons such as data collection errors, missing observations, or irregularly spaced data. Interpolation is a powerful technique that can help fill in these gaps, enabling data analysts to work with a complete dataset. In this section, we’ll explore how to interpolate missing values in a time series dataset using Excel.
One of the key challenges when interpolating time series data is handling irregularly spaced data. This can occur when data is collected at non-uniform intervals, such as daily, weekly, or monthly observations. To overcome this, Excel provides several interpolation methods, including linear, polynomial, and spline interpolation. By choosing the right interpolation method, data analysts can ensure that the interpolated values accurately reflect the underlying trend.
For example, let’s say we have a time series dataset with daily temperature readings, but some values are missing. We can use the TREND function to interpolate the missing values, taking into account the irregularly spaced data. By doing so, we can create a complete dataset that can be used for further analysis, such as forecasting or trend analysis.
When interpolating missing values in a time series, it’s essential to consider the underlying trend and pattern of the data. This can help ensure that the interpolated values are accurate and reliable. Additionally, data analysts should be cautious of over-interpolation, which can lead to inaccurate results. By following best practices and using the right interpolation method, data analysts can effectively fill in missing values in a time series dataset using Excel.
By learning how to interpolate in Excel, data analysts can unlock the full potential of their time series data, enabling them to make more accurate predictions and informed decisions. In the next section, we’ll discuss common interpolation errors and how to avoid them.
Common Interpolation Errors and How to Avoid Them
When performing interpolation in Excel, it’s essential to avoid common mistakes that can lead to inaccurate results. By being aware of these errors, data analysts can ensure that their interpolated values are reliable and accurate. In this section, we’ll discuss common interpolation errors and provide guidance on how to avoid them.
One of the most common errors is incorrect data formatting. This can occur when the data is not organized correctly, leading to incorrect interpolation results. To avoid this, it’s essential to ensure that the data is properly formatted, with the x-values in one column and the y-values in another.
Another common error is ignoring data trends. When interpolating, it’s essential to consider the underlying trend and pattern of the data. Ignoring these trends can lead to inaccurate interpolated values. By analyzing the data trend, data analysts can choose the right interpolation method and ensure that the interpolated values are accurate.
Additionally, over-interpolation can be a common mistake. This occurs when too many interpolated values are calculated, leading to inaccurate results. To avoid this, data analysts should only interpolate the necessary values and avoid over-interpolating.
By being aware of these common interpolation errors, data analysts can ensure that their interpolated values are accurate and reliable. By following best practices and avoiding common mistakes, data analysts can effectively learn how to interpolate in Excel and unlock the full potential of their data.
By avoiding these common errors, data analysts can ensure that their interpolated values are accurate and reliable, enabling them to make informed decisions and drive business growth. In the next section, we’ll explore real-world applications of interpolation in Excel.
Real-World Applications of Interpolation in Excel
Interpolation is a powerful technique in Excel that has numerous real-world applications. By learning how to interpolate in Excel, data analysts can unlock the full potential of their data and make informed decisions. In this section, we’ll explore some examples of how interpolation is used in real-world scenarios.
One common application of interpolation is in sales forecasting. By analyzing historical sales data, businesses can use interpolation to fill in missing values and predict future sales trends. This enables them to make informed decisions about inventory management, pricing, and marketing strategies.
Another example is in stock market analysis. Interpolation can be used to fill in missing values in stock price data, enabling analysts to identify trends and patterns. This can help investors make informed decisions about buying and selling stocks.
In addition, interpolation is used in weather forecasting to fill in missing values in temperature and precipitation data. This enables meteorologists to predict weather patterns and issue accurate forecasts.
Interpolation is also used in healthcare to analyze patient data and identify trends. By filling in missing values, healthcare professionals can identify patterns and make informed decisions about patient care.
These are just a few examples of how interpolation is used in real-world scenarios. By learning how to interpolate in Excel, data analysts can unlock the full potential of their data and make informed decisions. In the next section, we’ll explore tips and tricks for advanced interpolation in Excel.
Tips and Tricks for Advanced Interpolation in Excel
Once you’ve mastered the basics of interpolation in Excel, you can take your skills to the next level by learning advanced techniques. In this section, we’ll explore some tips and tricks for performing more complex interpolations using Excel’s built-in functions.
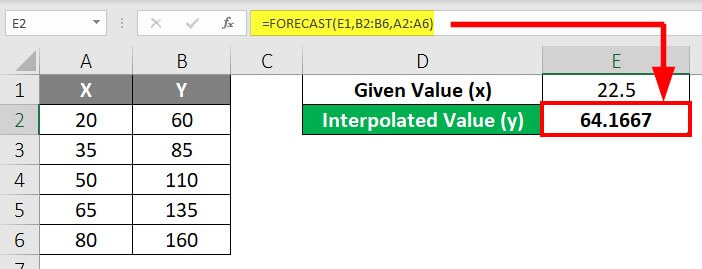
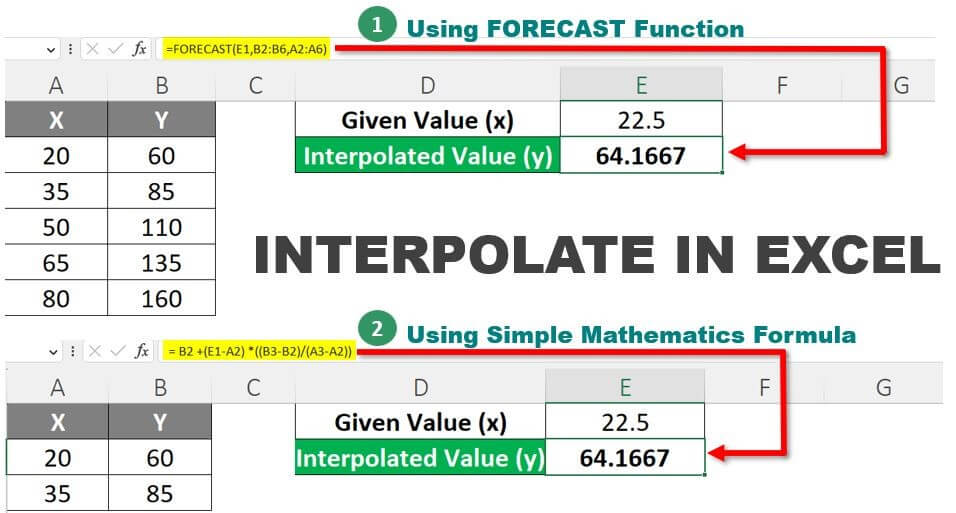
One advanced technique is using the FORECAST function to perform exponential smoothing. This function is particularly useful when working with time series data that exhibits a strong trend. By using the FORECAST function, you can create a more accurate forecast of future values.
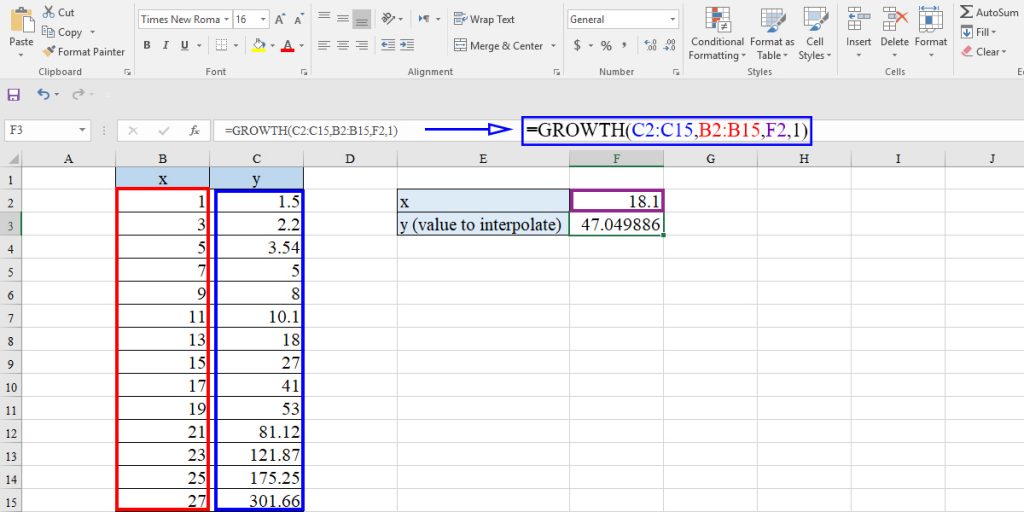
Another advanced technique is using the GROWTH function to perform logarithmic interpolation. This function is useful when working with data that exhibits exponential growth or decay. By using the GROWTH function, you can create a more accurate model of the data.
In addition, you can use Excel’s built-in functions to perform multiple regression analysis. This involves using multiple variables to predict the value of another variable. By using multiple regression analysis, you can create a more accurate model of the data and make more informed decisions.
When performing advanced interpolation in Excel, it’s essential to understand the underlying mathematics of the functions. This will enable you to choose the right function for your data and avoid common errors. By mastering advanced interpolation techniques, you can unlock the full potential of your data and make more informed decisions.
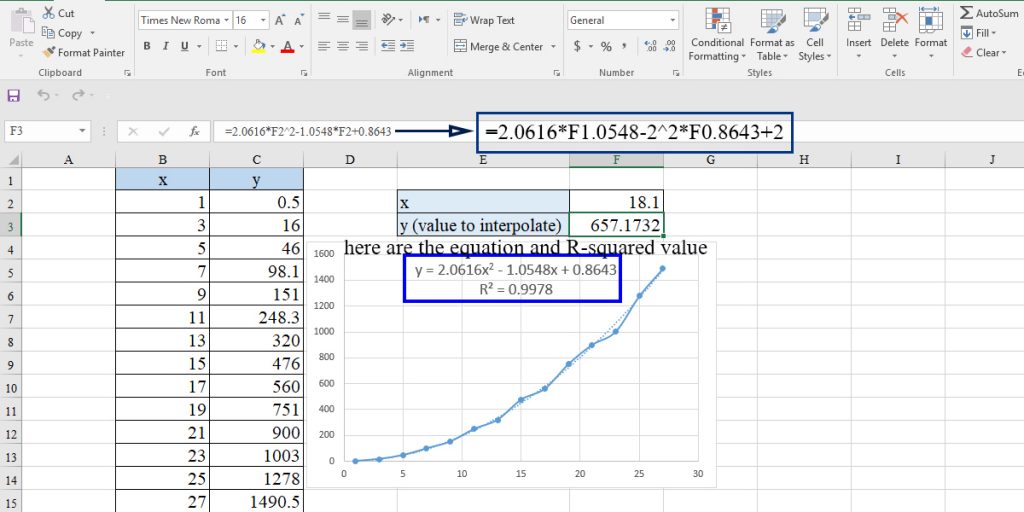
For example, you can use the TREND function to perform polynomial interpolation. This involves using a polynomial equation to model the data and make predictions. By using the TREND function, you can create a more accurate model of the data and make more informed decisions.
By learning these advanced interpolation techniques, you can take your data analysis skills to the next level and make more informed decisions. In the next section, we’ll summarize the key takeaways from the article and provide best practices for interpolation in Excel.
Best Practices for Interpolation in Excel: A Summary
In this article, we’ve covered the importance of interpolation in Excel, including how to choose the right interpolation method, perform interpolation using the TREND function, and handle missing values in time series data. We’ve also discussed common errors to avoid and provided examples of real-world applications of interpolation in Excel.
When it comes to how to interpolate in Excel, it’s essential to understand the different interpolation methods available, including linear, polynomial, and spline interpolation. By choosing the right method for your data, you can ensure accurate results and make informed decisions.
In addition, it’s crucial to avoid common errors, such as incorrect data formatting and ignoring data trends. By following best practices, you can ensure that your interpolation results are accurate and reliable.
By mastering the techniques outlined in this article, you can take your data analysis skills to the next level and make more informed decisions. Whether you’re forecasting sales, predicting stock prices, or analyzing time series data, interpolation in Excel is a powerful tool that can help you achieve your goals.
Remember to always choose the right interpolation method for your data, avoid common errors, and use advanced techniques, such as the FORECAST and GROWTH functions, to perform more complex interpolations. By following these best practices, you can ensure accurate results and make informed decisions.
In conclusion, interpolation in Excel is a powerful tool that can help you fill in missing values, forecast future trends, and make informed decisions. By following the best practices outlined in this article, you can master the art of interpolation in Excel and take your data analysis skills to the next level.


