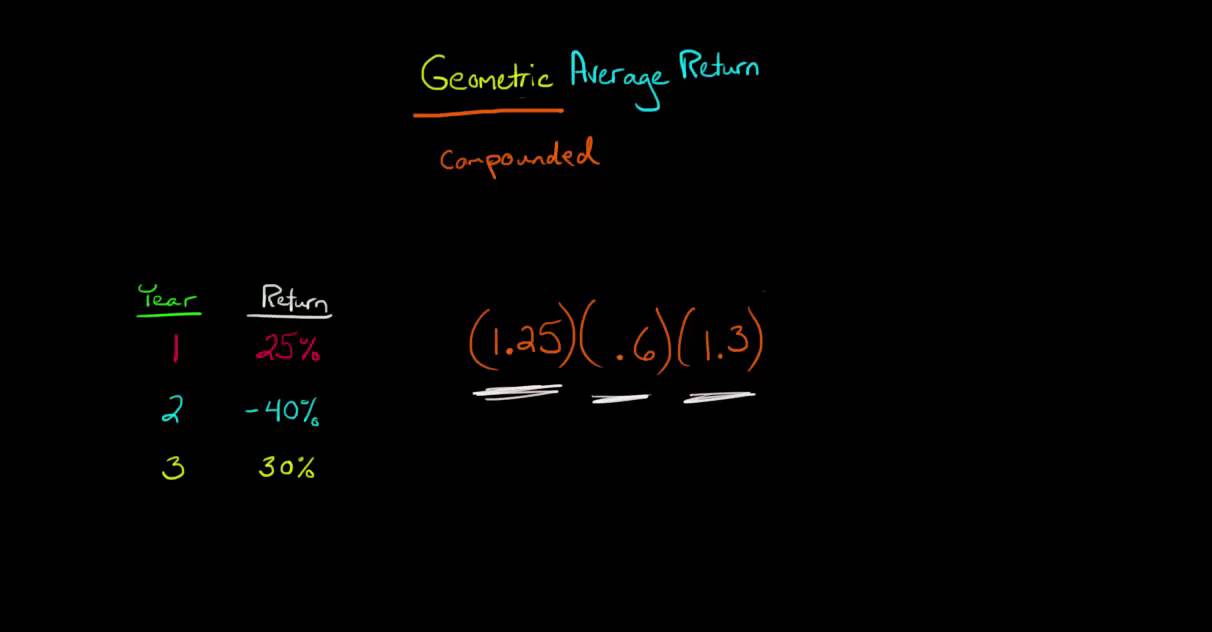
Understanding Geometric Average Return
Geometric average return is a crucial concept in investment analysis, particularly when evaluating the performance of long-term investments. This metric offers a more accurate representation of returns compared to the arithmetic average return, especially for investments with compounding interest or returns. The geometric average return calculates the true rate at which an investment has grown over a specific period, accounting for the compounding effect. In other words, it reflects the consistent, annualized rate of return that an investor could expect to earn on their investment, making it an essential tool for comparing different investment options and making informed financial decisions.
When discussing the geometric average return, it is essential to distinguish it from the arithmetic average return. The arithmetic average return is a simple mean of the annual returns, which does not account for the compounding effect. As a result, the arithmetic average return tends to overstate the actual growth rate of an investment, particularly when returns vary significantly from year to year.
In contrast, the geometric average return provides a more realistic and accurate measure of long-term investment performance by accounting for the compounding effect. This makes it an indispensable tool for investors and financial analysts seeking to understand the true growth rate of their investments and make well-informed decisions.

Click Image to Find Quantum Products
Preparing Your Data in Excel
To calculate the geometric average return in Excel, you must first prepare your data by inputting and formatting the necessary financial information. This section will guide you through the process, ensuring that your data is correctly structured for the subsequent calculations.
Step 1: Input Historical Stock Prices or Portfolio Returns
Begin by inputting the historical stock prices or portfolio returns into Excel. Label the columns and rows appropriately, such as “Date,” “Stock Price,” or “Portfolio Return.” Ensure that the data is organized chronologically, with the earliest date in the first row and the latest date in the last row.
Step 2: Calculate Periodic Returns
Next, calculate the periodic returns for each time interval, such as daily, weekly, or monthly returns. To calculate the periodic return, use the formula:
(Current Period Value - Previous Period Value) / Previous Period Value
For example, to calculate the monthly return, input the formula in a new column next to your data, and drag it down to apply it to the entire dataset.
Step 3: Format the Data
Format the data to make it easier to read and analyze. Apply number formatting to the periodic return column, using the percentage format with two decimal places. Additionally, consider using conditional formatting to highlight extreme returns, such as those greater than 5% or less than -5%.
By following these steps, you will have prepared your data in Excel for calculating the geometric average return. Proper data preparation is essential for ensuring accurate results and facilitating a smooth calculation process.
Calculating the Arithmetic Average Return
The arithmetic average return is a fundamental concept in investment analysis, serving as an intermediate step towards calculating the geometric average return. The arithmetic average return is a simple mean of the periodic returns and can provide insights into the overall performance of your investment. To calculate the arithmetic average return in Excel, follow these steps:
Step 1: Calculate the Periodic Returns
Using historical stock prices or portfolio returns, calculate the periodic returns for each time interval, such as daily, weekly, or monthly returns.
Step 2: Calculate the Arithmetic Average Return
To calculate the arithmetic average return, use the formula:
Sum of Periodic Returns / Number of Periods
In Excel, input the formula in a new cell, and replace the “Sum of Periodic Returns” with the cell range containing the periodic returns, and replace “Number of Periods” with the count of the periodic returns.
Step 3: Format the Arithmetic Average Return
Format the arithmetic average return cell as a percentage with two decimal places to ensure consistency with the periodic returns.
Calculating the arithmetic average return is a crucial step in determining the geometric average return, which offers a more accurate representation of long-term investment performance compared to the arithmetic average return.
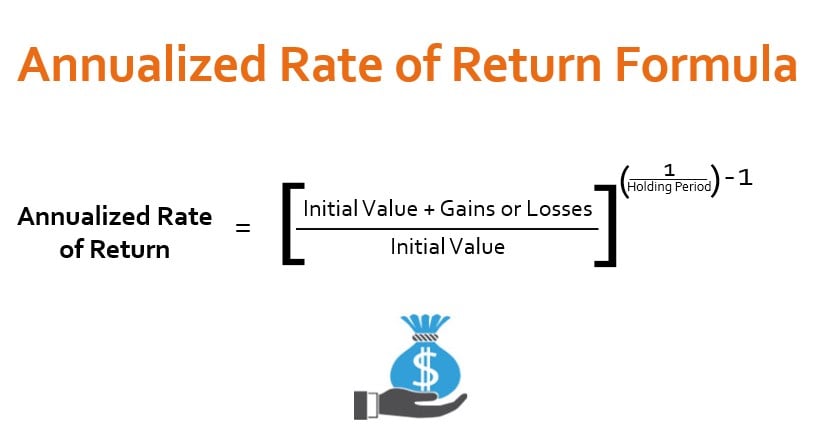
Transforming the Arithmetic Average Return
To calculate the geometric average return, you must first transform the arithmetic average return into a continuous compounded return series. This step is essential because the geometric average return assumes constant compounding, while the arithmetic average return does not.
The Formula for Transforming the Arithmetic Average Return
To transform the arithmetic average return into a continuous compounded return series, use the following formula:
(1 + Arithmetic Average Return) ^ (1 / Number of Periods) - 1
This formula raises the quantity (1 + Arithmetic Average Return) to the power of (1 / Number of Periods) and then subtracts 1 from the result.
Example in Excel
Assuming you have calculated the arithmetic average return as 0.12 (or 12%) for an annual dataset, you can transform it into a continuous compounded return series using the formula:
(1 + 0.12) ^ (1 / 1) - 1
In Excel, input the formula in a new cell as:
= (1 + A1) ^ (1 / 1) - 1
Where A1 contains the arithmetic average return (0.12).
By transforming the arithmetic average return into a continuous compounded return series, you have completed a crucial step towards calculating the geometric average return. This transformed series will provide a more accurate representation of long-term investment performance compared to the arithmetic average return.
Calculating the Geometric Average Return in Excel
Now that you have prepared your data and transformed the arithmetic average return into a continuous compounded return series, you can calculate the geometric average return. This measure provides a more accurate representation of long-term returns compared to the arithmetic average return.
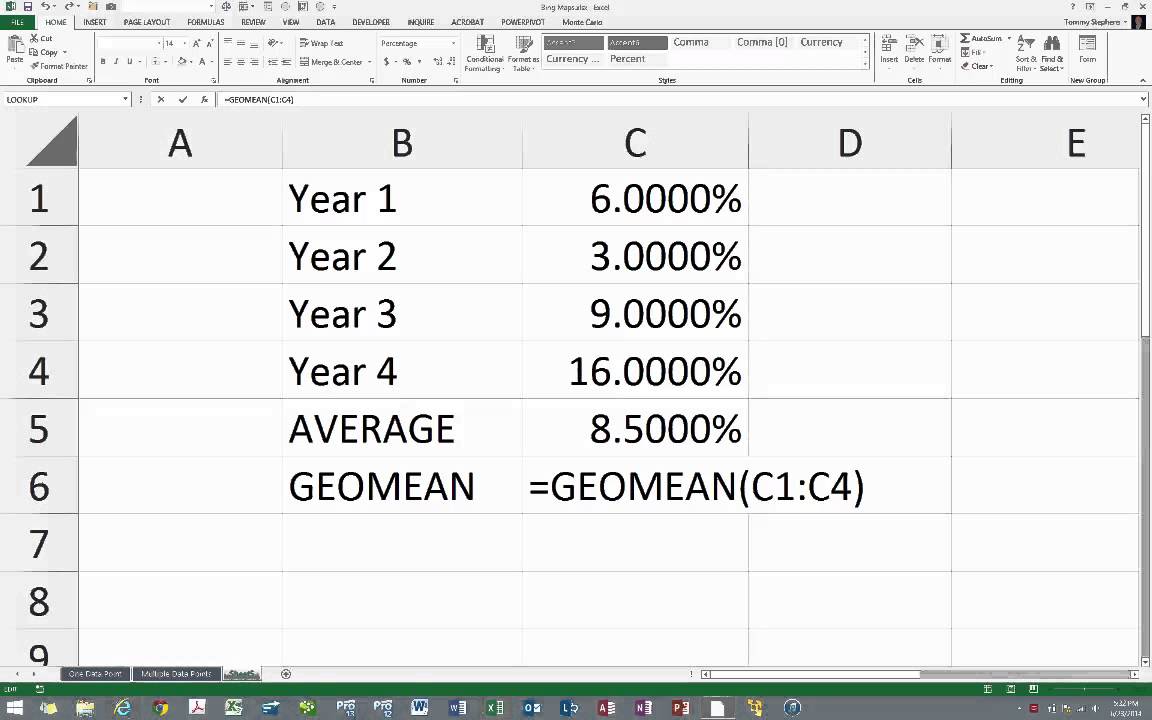
Step 1: Insert the Geometric Mean Function
To calculate the geometric average return, you can use Excel’s GEOMEAN function. This function calculates the geometric mean of an array of numbers. Select an empty cell where you want the geometric average return to be displayed, then type “=GEOMEAN” followed by an opening parenthesis.
Step 2: Select the Continuous Compounded Return Series
Click and drag to select the continuous compounded return series you created earlier. After selecting the range, close the parenthesis and press Enter. Excel will then calculate and display the geometric average return for your dataset.
Step 3: Format the Result
To make the result easier to read, you can format it as a percentage. Right-click on the cell containing the geometric average return, choose “Format Cells“, select “Percentage“, and set the number of decimal places as desired. Click “OK” to apply the formatting.
Example:
Suppose your continuous compounded return series is in cells B2 to B11. To calculate the geometric average return, you would type “=GEOMEAN(B2:B11)” in an empty cell, press Enter, and format the result as a percentage. The result would represent the geometric average return for the selected period.
Interpreting the Results
The calculated geometric average return provides valuable insights into the long-term performance of an investment. When comparing different investment options, a higher geometric average return generally indicates better performance. However, it is essential to consider other factors, such as risk, volatility, and investment horizon, before making a final decision.
Advanced Techniques: Using Excel Functions
In addition to the GEOMEAN function, you can also use the PRODUCT function to calculate the geometric average return. The PRODUCT function multiplies all the numbers in a given range and then raises the result to the power of 1 divided by the count of numbers in the range. To use the PRODUCT function, type “=PRODUCT(B2:B11)^(1/COUNT(B2:B11))” in an empty cell, press Enter, and format the result as a percentage.
Troubleshooting Common Issues
When calculating the geometric average return, you may encounter issues such as negative returns or missing data points. Negative returns can be addressed by using the ABS function to remove the negative sign before calculating the geometric average return. For missing data points, consider using Excel’s IFERROR function to replace errors with a default value, such as zero or a user-defined message.

Interpreting the Results: Geometric Average Return in Investment Analysis
Calculating the geometric average return is essential for evaluating the performance of investment options. By understanding how to interpret the geometric average return, you can make informed financial decisions, compare different investment opportunities, assess long-term performance, and monitor portfolio performance.
Comparing Investment Options
When comparing the geometric average return of various investment options, a higher return generally indicates better performance. However, it is crucial to consider other factors, such as risk, volatility, and investment horizon, as they can significantly impact the overall return and suitability of an investment for your specific goals and needs.
Assessing Long-Term Performance
The geometric average return is particularly useful for assessing long-term investment performance, as it takes into account the compounding effect of returns over time. This makes it a more accurate measure than the arithmetic average return when evaluating the performance of investments held for extended periods.
Monitoring Portfolio Performance
Regularly calculating and monitoring the geometric average return of your investment portfolio can help you track its performance and make adjustments as needed. By comparing the geometric average return of your portfolio to relevant benchmarks or other investment options, you can identify areas for improvement and optimize your investment strategy.
Informed Financial Decisions
Understanding the geometric average return allows you to make more informed financial decisions, such as choosing between different investment options, determining the optimal asset allocation, and evaluating the performance of your investment manager or financial advisor. By incorporating the geometric average return into your investment analysis, you can better understand the potential risks and rewards associated with various investment choices.

Advanced Techniques: Using Excel Functions to Calculate Geometric Average Return
Excel offers several built-in functions that can simplify the process of calculating the geometric average return. The two primary functions for this purpose are GEOMEAN and PRODUCT. This section will explain how to use these functions and provide examples for each method.
Method 1: Using the GEOMEAN Function
The GEOMEAN function calculates the geometric mean of an array or a range of cells. To use this function for calculating the geometric average return, follow these steps:
- Input the GEOMEAN function: Type “=GEOMEAN(” in an empty cell.
- Select the transformed return series: Click and drag to select the continuous compounded return series you created earlier.
- Close the parenthesis and press Enter: Type “)” and press Enter to calculate the geometric average return.
- Format the result: Right-click on the cell containing the result, choose “Format Cells“, select “Percentage“, and set the number of decimal places as desired. Click “OK” to apply the formatting.
Method 2: Using the PRODUCT Function
The PRODUCT function multiplies all the numbers in a given range and then raises the result to the power of 1 divided by the count of numbers in the range. To use this function for calculating the geometric average return, follow these steps:
- Input the PRODUCT function: Type “=PRODUCT(” in an empty cell.
- Select the transformed return series: Click and drag to select the continuous compounded return series you created earlier.
- Calculate 1 divided by the count of numbers: Type “)^(1/COUNT(” followed by the transformed return series.
- Close the parenthesis and press Enter: Type “))” and press Enter to calculate the geometric average return.
- Format the result: Right-click on the cell containing the result, choose “Format Cells“, select “Percentage“, and set the number of decimal places as desired. Click “OK” to apply the formatting.
By using these Excel functions, you can quickly and accurately calculate the geometric average return for your investment data, making it easier to evaluate long-term performance and make informed financial decisions.
Troubleshooting Common Issues: Calculating Geometric Average Return in Excel
When calculating the geometric average return in Excel, users may encounter several common issues. This section will address these challenges and provide solutions and workarounds to help you achieve accurate results.
Issue 1: Negative Returns
If your dataset includes negative returns, you cannot directly calculate the geometric average return using the GEOMEAN or PRODUCT functions, as these functions require positive numbers. To address this issue, you can use the ABS function to calculate the absolute value of each return before calculating the geometric average return. However, keep in mind that absolute returns do not account for losses, so this method should be used with caution.
Issue 2: Missing Data Points
If your dataset has missing data points, the geometric average return calculation may be inaccurate or impossible. To handle missing data, you can replace missing values with a default value, such as zero or the average return for the dataset. Alternatively, you can use Excel’s IFERROR function to exclude cells with errors from the calculation.
Issue 3: Large Datasets
Calculating the geometric average return for large datasets can be time-consuming and computationally intensive. To speed up the process, consider breaking your dataset into smaller subsets and calculating the geometric average return for each subset separately. Then, calculate the overall geometric average return for the entire dataset using the same methods described in this article.
Issue 4: Inaccurate Results Due to Rounding
When working with financial data, rounding errors can lead to inaccurate geometric average return calculations. To minimize rounding errors, perform calculations using the highest possible precision and format the final result as desired. Additionally, avoid rounding intermediate results when possible.
Issue 5: Misunderstanding the Results
The geometric average return can be difficult to interpret, especially for those unfamiliar with investment analysis. To avoid misunderstandings, always remember that the geometric average return represents the long-term compounded growth rate of an investment, accounting for the compounding effect of returns over time. Comparing geometric average returns of different investment options can help you make informed financial decisions, but keep in mind that other factors, such as risk and volatility, should also be considered.
By understanding these common issues and implementing the suggested solutions, you can calculate the geometric average return accurately and confidently in Excel, enabling you to evaluate long-term investment performance and make informed financial decisions.