Why Annualized Returns Matter in Investment Analysis
Investment analysis relies heavily on accurate performance metrics to inform investment decisions. Annualized returns are a crucial component of this analysis, as they provide a standardized way to evaluate investment performance over time. By calculating annualized returns, investors can compare the performance of different investments, assess risk, and make informed decisions about their portfolio. Moreover, annualized returns help investors identify top-performing assets, optimize their investment strategy, and achieve their desired risk-return profile. In essence, annualized returns are a vital tool for investors seeking to maximize their returns while minimizing risk. To unlock the full potential of annualized returns, it is essential to understand how to calculate them accurately and efficiently, particularly when working with monthly return data in Excel. This guide will walk you through the process of calculating annualized returns from monthly returns in Excel, highlighting common pitfalls to avoid and advanced techniques to master.

Click Image to Find Quantum Products

Understanding Monthly Returns: The Foundation of Annualized Calculations
Monthly returns are a fundamental component of investment analysis, serving as the building blocks for calculating annualized returns. A monthly return represents the percentage change in the value of an investment over a single month. To calculate a monthly return, investors can use the following formula: ((Current Month’s Value – Previous Month’s Value) / Previous Month’s Value) x 100. For example, if an investment’s value increased from $100 to $105 in a month, the monthly return would be 5%. Monthly returns can be positive or negative, depending on the investment’s performance. A series of monthly returns provides a comprehensive picture of an investment’s performance over time, enabling investors to identify trends, patterns, and areas for improvement. When calculating annualized returns from monthly returns in Excel, it is essential to understand how to correctly aggregate these monthly returns to produce an accurate annualized return. This guide will provide a step-by-step walkthrough of this process, ensuring that investors can make informed decisions about their investments.

How to Calculate Annualized Returns from Monthly Returns in Excel
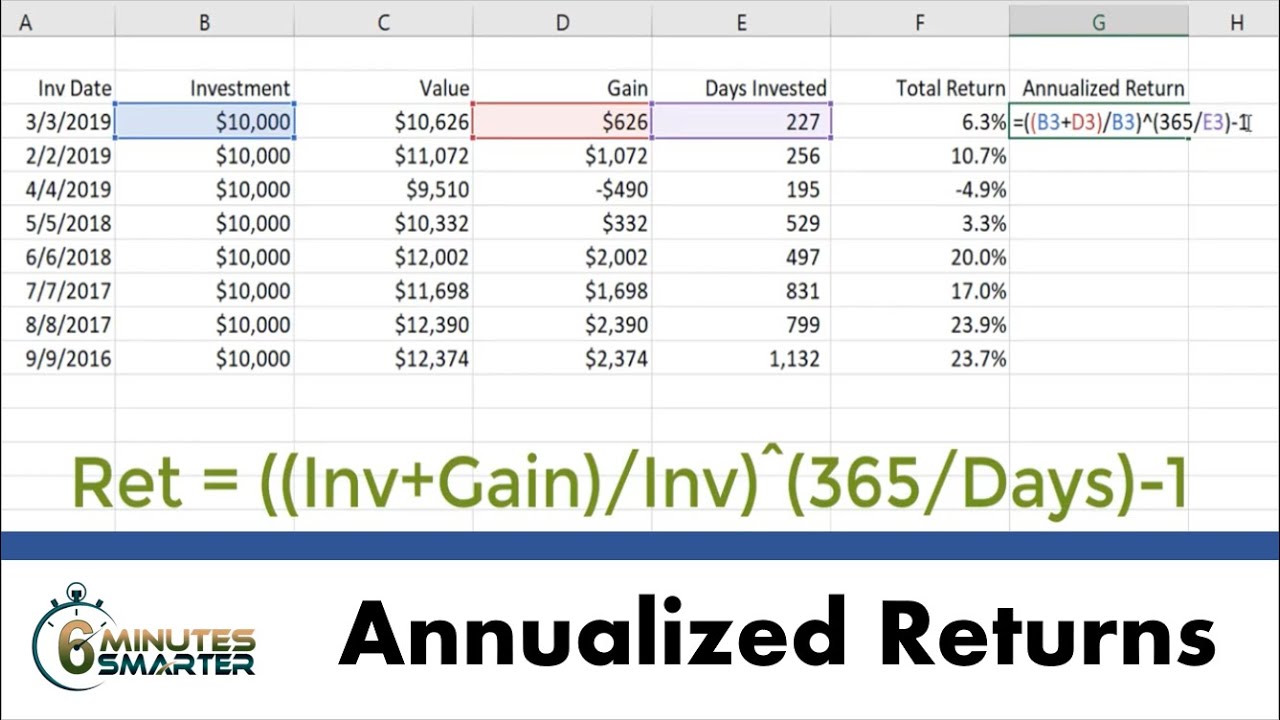
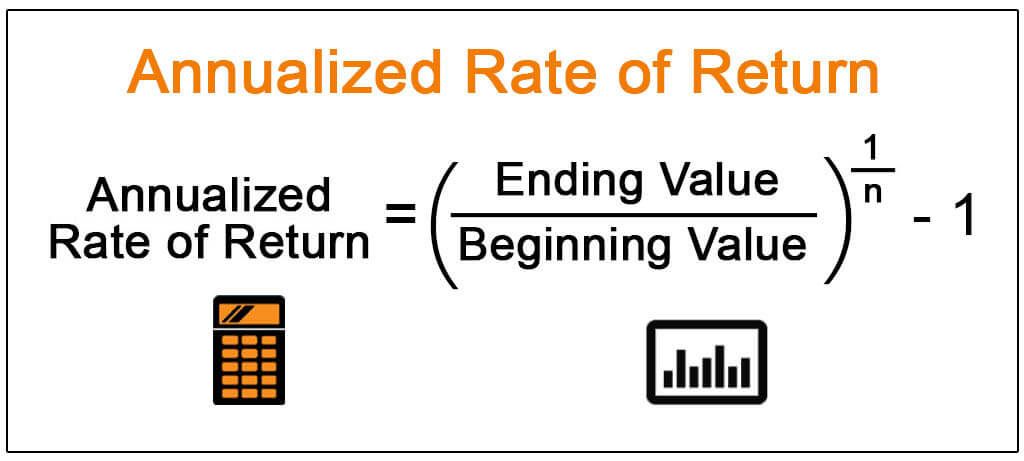
To calculate annualized returns from monthly returns in Excel, investors can use the following formula: ((1 + Monthly Return)^12) – 1. This formula takes into account the compounding effect of monthly returns over a 12-month period. For example, if an investment has a monthly return of 0.5%, the annualized return would be approximately 6.17%. To apply this formula in Excel, follow these steps:
1. Enter the monthly return data in a column, such as A1:A12.
2. In a new cell, enter the formula: =(1+A1)^12-1, where A1 is the first monthly return.
3. Copy the formula down to calculate the annualized return for each month.
4. To calculate the overall annualized return for the entire period, use the AVERAGE function to average the monthly returns, and then apply the formula.
It is essential to use the correct formula and avoid common mistakes, such as ignoring compounding or using incorrect formulas. By following these steps and using the correct formula, investors can accurately calculate annualized returns from monthly returns in Excel, enabling them to make informed investment decisions. Remember, mastering the calculation of annualized returns is crucial for investment success, as it provides a standardized way to evaluate investment performance and compare different investments.

The Power of Compounding: How Annualized Returns Reflect Investment Growth
Compounding is a crucial concept in investment analysis, as it significantly impacts the calculation of annualized returns. Compounding occurs when the returns on an investment are reinvested to generate additional returns, creating a snowball effect that can lead to substantial growth over time. When calculating annualized returns, it is essential to take into account the compounding effect of monthly returns. This is because monthly returns are not simply added together to produce an annual return; instead, they are compounded to reflect the investment’s growth over the entire year.
For example, consider an investment with a monthly return of 1%. If the returns are compounded monthly, the annualized return would be approximately 12.68%, rather than simply 12% (1% x 12 months). This illustrates the significant impact of compounding on investment growth. By understanding the power of compounding, investors can better appreciate the importance of annualized returns in evaluating investment performance and making informed decisions.
In Excel, the formula for calculating annualized returns from monthly returns takes into account the compounding effect. The formula, ((1 + Monthly Return)^12) – 1, reflects the compounding of monthly returns over a 12-month period. By using this formula, investors can accurately calculate annualized returns and gain a deeper understanding of their investment’s growth potential.
Common Pitfalls to Avoid When Calculating Annualized Returns
When calculating annualized returns, investors must be aware of common mistakes that can lead to inaccurate results. One of the most critical errors is ignoring the compounding effect of monthly returns. Failing to account for compounding can result in significantly understated annualized returns, leading to poor investment decisions. Another common mistake is using incorrect formulas or misunderstanding the calculation process. This can occur when investors use a simple average of monthly returns instead of the correct formula, ((1 + Monthly Return)^12) – 1, which takes into account the compounding effect.
Additionally, investors must also consider fees and taxes when calculating annualized returns. Failing to account for these expenses can result in overstated returns, leading to unrealistic expectations and poor investment decisions. Furthermore, investors should be cautious when using historical data to calculate annualized returns, as past performance is not always indicative of future results.
Other common pitfalls include using inconsistent time periods, failing to adjust for inflation, and neglecting to consider the impact of dividends and interest on returns. By being aware of these common mistakes, investors can avoid errors and ensure accurate calculations of annualized returns. This, in turn, enables them to make informed investment decisions and achieve their long-term financial goals. By mastering the calculation of annualized returns in Excel, investors can gain a competitive edge in the market and make data-driven decisions with confidence.
Real-World Applications of Annualized Returns: Making Informed Investment Decisions
In the world of investments, annualized returns play a crucial role in evaluating performance, comparing investments, and making informed decisions. For instance, when evaluating mutual fund performance, investors can use annualized returns to compare the fund’s performance over time and make informed decisions about whether to invest or divest. Similarly, when comparing investment strategies, annualized returns provide a standardized metric for evaluating the performance of different strategies and selecting the most effective one.
In addition, annualized returns are essential for assessing portfolio risk. By calculating the annualized return of a portfolio, investors can gain insights into the portfolio’s overall performance and risk profile. This information can be used to adjust the portfolio’s asset allocation, diversify investments, and minimize risk. Furthermore, annualized returns can be used to evaluate the performance of individual stocks, bonds, or other investment instruments, enabling investors to make informed decisions about their investment portfolios.
For example, consider an investor who is evaluating two different investment strategies: a conservative bond portfolio and an aggressive stock portfolio. By calculating the annualized returns of each portfolio, the investor can compare their performance and make an informed decision about which strategy to pursue. If the bond portfolio has an annualized return of 4% and the stock portfolio has an annualized return of 8%, the investor may choose to invest in the stock portfolio, despite its higher risk, due to its higher potential for returns.
By applying the concepts of annualized returns in real-world investment scenarios, investors can make data-driven decisions, optimize their investment portfolios, and achieve their long-term financial goals. Whether evaluating mutual fund performance, comparing investment strategies, or assessing portfolio risk, annualized returns provide a powerful tool for investors to navigate the complex world of investments.

Advanced Techniques for Calculating Annualized Returns in Excel
While the basic formula for calculating annualized returns from monthly returns in Excel is straightforward, there are advanced techniques that can be used to streamline the process and perform more complex investment analysis. One such technique is using arrays to calculate annualized returns. By using arrays, investors can calculate annualized returns for multiple investments or time periods simultaneously, making it easier to compare and analyze performance.
Another advanced technique is using pivot tables to calculate annualized returns. Pivot tables allow investors to easily manipulate and analyze large datasets, making it possible to calculate annualized returns for multiple investments or time periods with ease. Additionally, pivot tables can be used to create custom reports and dashboards, providing a comprehensive view of investment performance.
Macros are another advanced technique that can be used to calculate annualized returns in Excel. Macros are sets of automated commands that can be used to perform repetitive tasks, such as calculating annualized returns for multiple investments or time periods. By using macros, investors can save time and reduce the risk of errors, making it easier to perform complex investment analysis.
For example, consider an investor who wants to calculate the annualized returns for a portfolio of 10 stocks over a 5-year period. Using arrays, pivot tables, or macros, the investor can easily calculate the annualized returns for each stock and the overall portfolio, providing a comprehensive view of performance. This information can then be used to make informed investment decisions, such as rebalancing the portfolio or adjusting the asset allocation.
By mastering these advanced techniques, investors can take their investment analysis to the next level, performing complex calculations with ease and making data-driven decisions to achieve investment success. Whether using arrays, pivot tables, or macros, these advanced techniques provide a powerful tool for investors to unlock insights and optimize their investment portfolios.

Conclusion: Mastering Annualized Returns for Investment Success
In conclusion, calculating annualized returns from monthly returns in Excel is a crucial skill for investors to master. By following the step-by-step guide outlined in this article, investors can accurately and efficiently calculate annualized returns, unlocking valuable insights into investment performance. Whether evaluating mutual fund performance, comparing investment strategies, or assessing portfolio risk, annualized returns provide a standardized metric for making informed investment decisions.
By avoiding common pitfalls and mastering advanced techniques, such as using arrays, pivot tables, or macros, investors can take their investment analysis to the next level. With the ability to calculate annualized returns with ease and accuracy, investors can focus on what matters most: achieving investment success.
Remember, calculating annualized returns is not just a mathematical exercise; it’s a key component of a successful investment strategy. By applying the concepts outlined in this article, investors can make data-driven decisions, optimize their investment portfolios, and achieve their long-term financial goals. So, practice and apply your newfound skills today, and start unlocking the full potential of your investments.
