Unlocking the Power of Standard Deviation
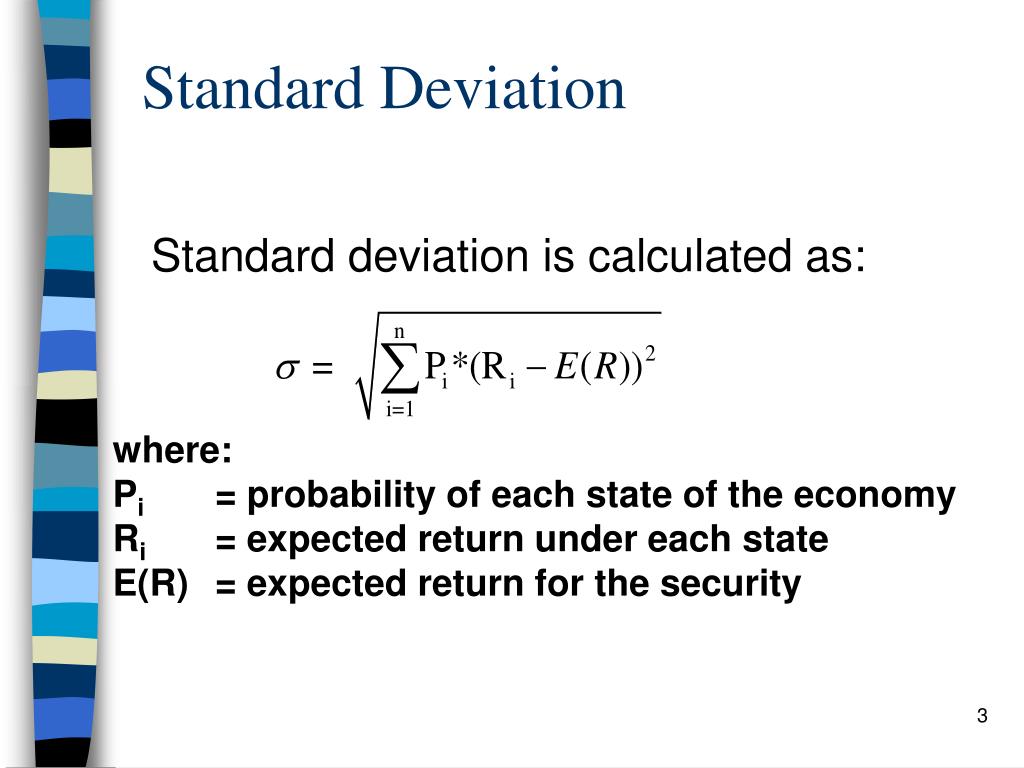
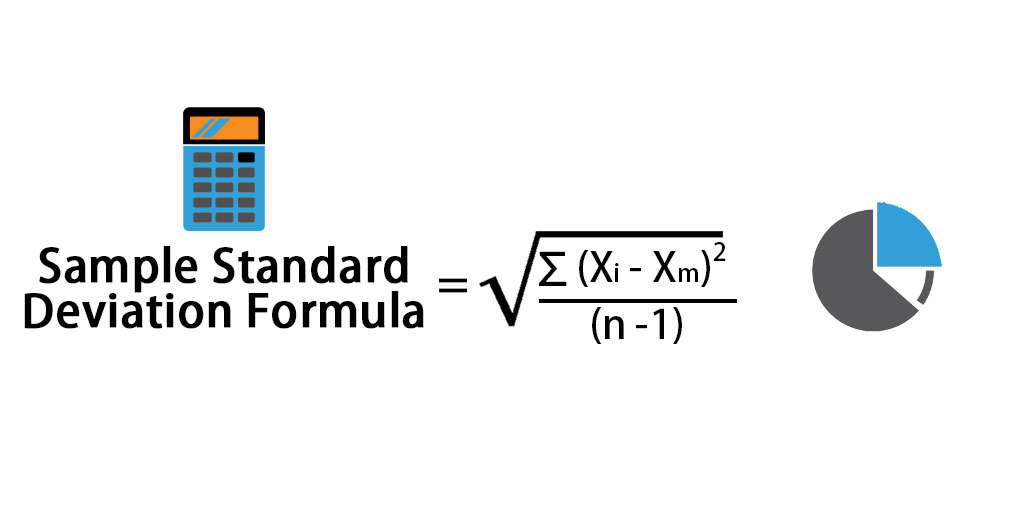
In the world of finance, understanding volatility is crucial for making informed investment decisions. One of the most widely used metrics to measure volatility is standard deviation. Standard deviation is a statistical concept that helps investors quantify the amount of uncertainty or risk associated with an investment. It provides a snapshot of the historical volatility of an asset, giving investors a better understanding of its potential future performance. In essence, standard deviation helps investors answer the question, “How much risk am I taking on with this investment?” By grasping the concept of standard deviation, investors can make more informed decisions about their portfolios, ultimately leading to better risk management and potentially higher returns. As we delve into the world of volatility analysis, it’s essential to understand the importance of standard deviation and how it can be annualized to provide a more accurate picture of an investment’s risk profile. In order to effectively manage risk, investors need to know how to annualize standard deviation, a crucial step in understanding the true volatility of an investment.
Understanding the Time Dimension: Why Annualization Matters
When it comes to measuring volatility, time is a critical factor. Standard deviation, as a standalone metric, does not take into account the time period over which the data is collected. This limitation can lead to misleading conclusions about an investment’s risk profile. Annualizing standard deviation addresses this issue by adjusting the metric to reflect the time dimension. By doing so, investors can gain a more accurate understanding of an investment’s volatility and make more informed decisions. The importance of annualization lies in its ability to provide a consistent and comparable measure of risk across different investments and time periods. Without annualization, investors may be comparing apples and oranges, which can result in suboptimal investment decisions. To truly grasp the concept of volatility, it’s essential to understand how to annualize standard deviation, a crucial step in mastering volatility analysis.
The Math Behind Annualization: A Simplified Approach
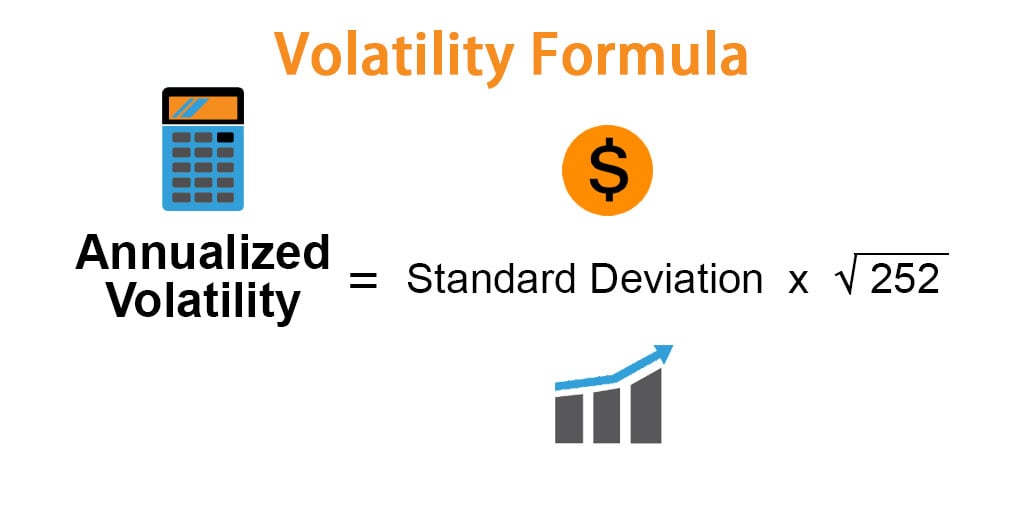
Now that we’ve established the importance of annualizing standard deviation, let’s dive into the math behind it. Annualizing standard deviation involves adjusting the metric to reflect a one-year time period. This is done by using the following formula: Annualized Standard Deviation = Standard Deviation × √(Number of Periods per Year). For example, if we have monthly data, we would use 12 as the number of periods per year. To illustrate this process, let’s consider an example. Suppose we have a stock with a monthly standard deviation of 2%. To annualize this metric, we would multiply it by √12, resulting in an annualized standard deviation of approximately 6.93%. This means that the stock’s annual volatility is around 6.93%. By understanding how to annualize standard deviation, investors can gain a more accurate understanding of an investment’s risk profile and make more informed decisions. In the next section, we’ll explore common pitfalls to avoid when annualizing standard deviation, ensuring that investors can accurately apply this metric to their investment decisions.
Common Pitfalls to Avoid When Annualizing Standard Deviation
When it comes to annualizing standard deviation, there are several common mistakes that investors should avoid. One of the most critical errors is making incorrect time period assumptions. For instance, if an investor is working with monthly data, they must ensure that they are using the correct number of periods per year (12) in the annualization formula. Failure to do so can result in inaccurate calculations and misleading conclusions about an investment’s risk profile. Another common pitfall is data inconsistencies, which can arise from using different data sources or time periods. To overcome these challenges, investors should carefully review their data and ensure that it is consistent and reliable. Additionally, investors should be aware of the limitations of annualized standard deviation, such as its sensitivity to extreme values and its assumption of normality. By being mindful of these potential pitfalls, investors can ensure that they are accurately applying the concept of how to annualize standard deviation and making informed investment decisions. By avoiding these common mistakes, investors can gain a more accurate understanding of an investment’s risk profile and make more informed decisions.
Real-World Applications of Annualized Standard Deviation
In finance, annualized standard deviation has numerous practical applications that can significantly impact investment decisions. One of the most critical applications is in portfolio risk management. By calculating the annualized standard deviation of a portfolio, investors can gain a better understanding of its overall risk profile and make informed decisions about asset allocation. For instance, an investor may use annualized standard deviation to identify high-risk assets and adjust their portfolio accordingly. Another key application is in performance evaluation, where annualized standard deviation can be used to assess the volatility of an investment over time. This allows investors to evaluate the performance of different investments and make informed decisions about which ones to hold or sell. Additionally, annualized standard deviation can be used in asset allocation, where it can help investors determine the optimal mix of assets to achieve their desired risk-return profile. By understanding how to annualize standard deviation, investors can unlock the power of this metric and make more informed investment decisions. In the next section, we’ll explore the importance of comparing annualized standard deviation across different assets.
Comparing Annualized Standard Deviation Across Different Assets
When it comes to investment decisions, comparing annualized standard deviation across different assets is crucial. This allows investors to evaluate the relative risk profiles of different investments and make informed decisions about which ones to hold or sell. For instance, an investor may compare the annualized standard deviation of a stock portfolio to that of a bond portfolio to determine which one is more volatile. By understanding how to annualize standard deviation, investors can gain valuable insights into the risk profiles of different assets. When comparing annualized standard deviation across different assets, it’s essential to consider the time period and data frequency used in the calculation. This ensures that the results are comparable and accurate. Additionally, investors should consider the underlying characteristics of each asset, such as its market capitalization, industry, and geographic region, to gain a more comprehensive understanding of its risk profile. By comparing annualized standard deviation across different assets, investors can optimize their portfolios and achieve their desired risk-return profile. In the next section, we’ll examine the role of annualized standard deviation in modern portfolio theory.
Annualized Standard Deviation in the Context of Modern Portfolio Theory
In modern portfolio theory, annualized standard deviation plays a critical role in portfolio optimization. By understanding how to annualize standard deviation, investors can better assess the risk-return profile of their portfolios and make informed decisions about asset allocation. In the context of modern portfolio theory, annualized standard deviation is used to quantify the volatility of a portfolio and its constituent assets. This allows investors to optimize their portfolios by selecting assets that offer the highest expected returns for a given level of risk. The concept of efficient frontier, which is a fundamental principle of modern portfolio theory, is also closely tied to annualized standard deviation. The efficient frontier represents the set of optimal portfolios that offer the highest expected returns for a given level of risk, and annualized standard deviation is used to calculate the risk of these portfolios. By understanding how to annualize standard deviation, investors can construct portfolios that lie on the efficient frontier, thereby maximizing their returns for a given level of risk. Furthermore, annualized standard deviation can be used to evaluate the performance of different portfolios and investment strategies, allowing investors to make informed decisions about which ones to adopt. In the next section, we’ll offer actionable advice on how to incorporate annualized standard deviation into an investment strategy.
Best Practices for Implementing Annualized Standard Deviation in Your Investment Strategy
When it comes to incorporating annualized standard deviation into an investment strategy, there are several best practices to keep in mind. First, it’s essential to select high-quality data that is consistent and reliable. This ensures that the annualized standard deviation calculations are accurate and meaningful. Next, investors should consider the time period used in the calculation, as this can significantly impact the results. For example, using a shorter time period may result in a higher annualized standard deviation, while a longer time period may result in a lower value. By understanding how to annualize standard deviation, investors can make informed decisions about the time period to use. Additionally, investors should consider the risk management implications of annualized standard deviation. By using annualized standard deviation to quantify risk, investors can develop strategies to mitigate potential losses and maximize returns. This may involve diversifying a portfolio, hedging against potential risks, or adjusting asset allocations. Finally, investors should regularly monitor and update their annualized standard deviation calculations to ensure that their investment strategy remains aligned with their risk tolerance and investment objectives. By following these best practices, investors can unlock the full potential of annualized standard deviation and make more informed investment decisions.


:max_bytes(150000):strip_icc()/annualize.asp-Final-57d8de49fc24424895bc03da0a5e823e.jpg)


