Understanding the Concept of Discounted Cash Flow
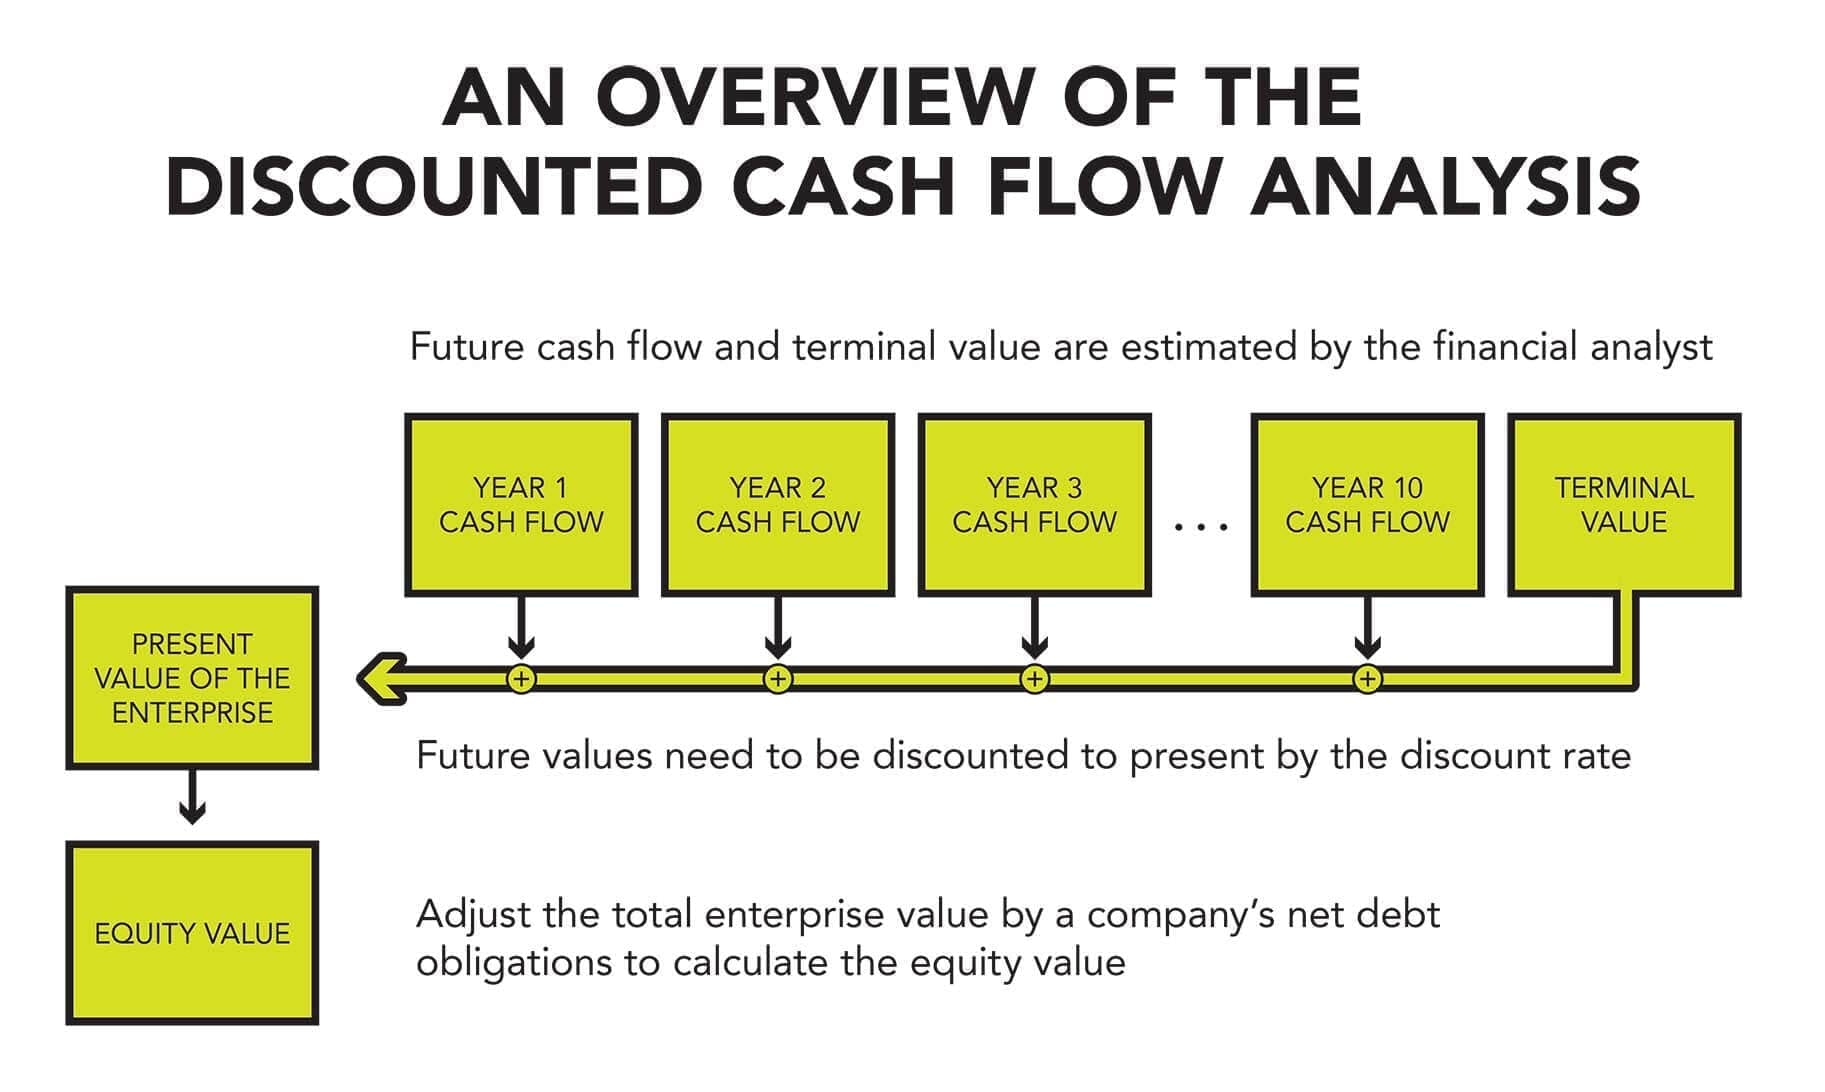
In the world of finance, discounted cash flow (DCF) analysis is a powerful tool used to evaluate the present value of future cash flows. This method is essential for investors and analysts seeking to make informed decisions about investments, projects, and company valuations. By applying the formula for discounted cash flow in Excel, businesses can determine the feasibility of projects, evaluate investment opportunities, and value companies. In essence, DCF analysis provides a framework for assessing the potential return on investment and making data-driven decisions. The importance of DCF analysis lies in its ability to help investors and analysts understand the time value of money, which is critical in today’s fast-paced business environment.
How to Calculate Discounted Cash Flow in Excel
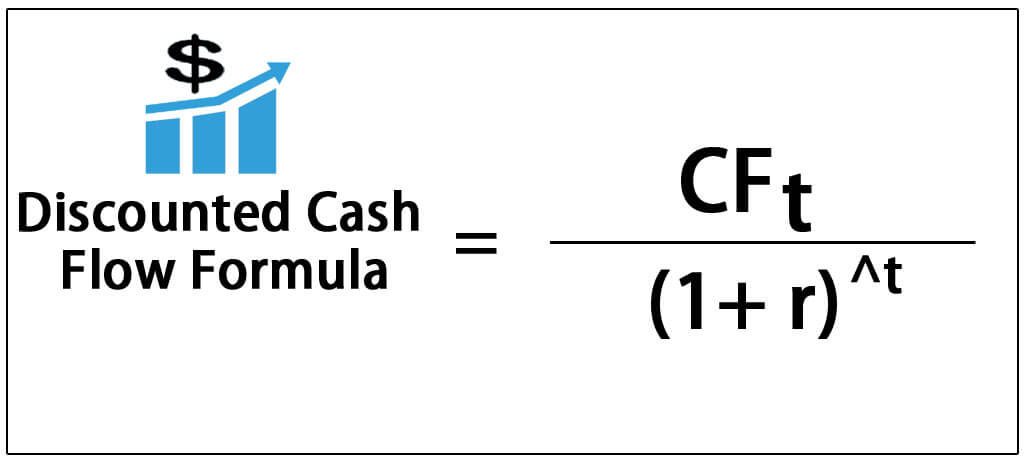
To calculate discounted cash flow (DCF) in Excel, it’s essential to understand the formula and its components. The formula for discounted cash flow in Excel is: PV = CF1 / (1 + r)^1 + CF2 / (1 + r)^2 + … + CFn / (1 + r)^n, where PV is the present value, CF is the cash flow, r is the discount rate, and n is the time period. To illustrate the process, let’s consider an example. Suppose an investment is expected to generate cash flows of $100, $120, and $150 over the next three years, with a discount rate of 10%. Using the formula, we can calculate the present value of these cash flows as follows: =100 / (1 + 0.10)^1 + 120 / (1 + 0.10)^2 + 150 / (1 + 0.10)^3. By following this step-by-step guide, investors and analysts can accurately calculate the present value of future cash flows and make informed decisions.
The Formula for Discounted Cash Flow: Breaking it Down
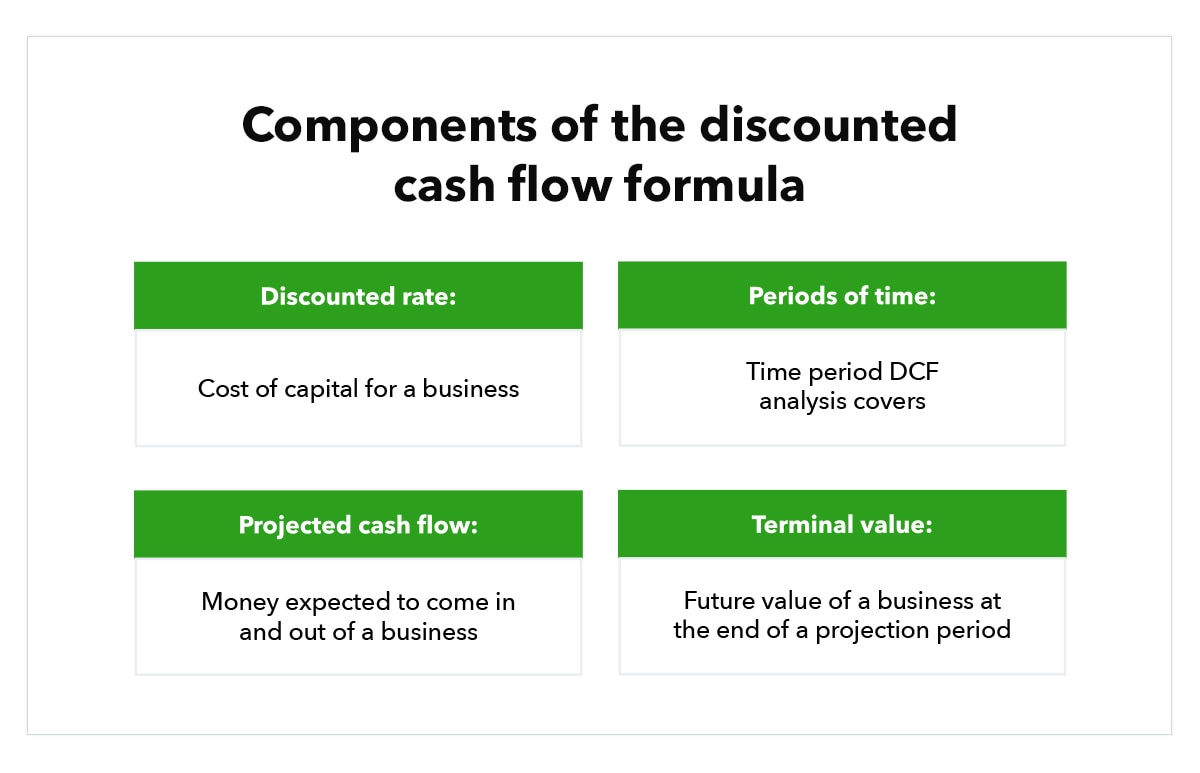
The formula for discounted cash flow in Excel is a powerful tool for evaluating the present value of future cash flows. The formula is: PV = CF1 / (1 + r)^1 + CF2 / (1 + r)^2 + … + CFn / (1 + r)^n, where PV is the present value, CF is the cash flow, r is the discount rate, and n is the time period. To fully understand the formula for discounted cash flow in Excel, it’s essential to break down its components and explain the role of each variable. The cash flow (CF) represents the expected future cash inflows or outflows, while the discount rate (r) reflects the cost of capital or the opportunity cost of investing in a project. The time period (n) represents the number of years over which the cash flows are expected to occur. By understanding the role of each variable, investors and analysts can accurately calculate the present value of future cash flows and make informed decisions.
Discount Rate: The Key to Accurate DCF Analysis
The discount rate is a critical component of the formula for discounted cash flow in Excel, as it reflects the cost of capital or the opportunity cost of investing in a project. Selecting an appropriate discount rate is essential to ensure accurate DCF analysis, as it directly affects the present value of future cash flows. There are several methods to determine the discount rate, including the cost of capital approach and the weighted average cost of capital (WACC) approach. The cost of capital approach involves estimating the rate of return required by investors, while the WACC approach takes into account the weighted average of the cost of debt and equity. For example, if a company’s cost of debt is 5% and its cost of equity is 10%, with a debt-to-equity ratio of 2:1, the WACC would be 6.67% [(2/3) x 5% + (1/3) x 10%]. By understanding the different methods for determining the discount rate, investors and analysts can ensure accurate DCF analysis and make informed decisions.
Applying DCF Analysis in Real-World Scenarios
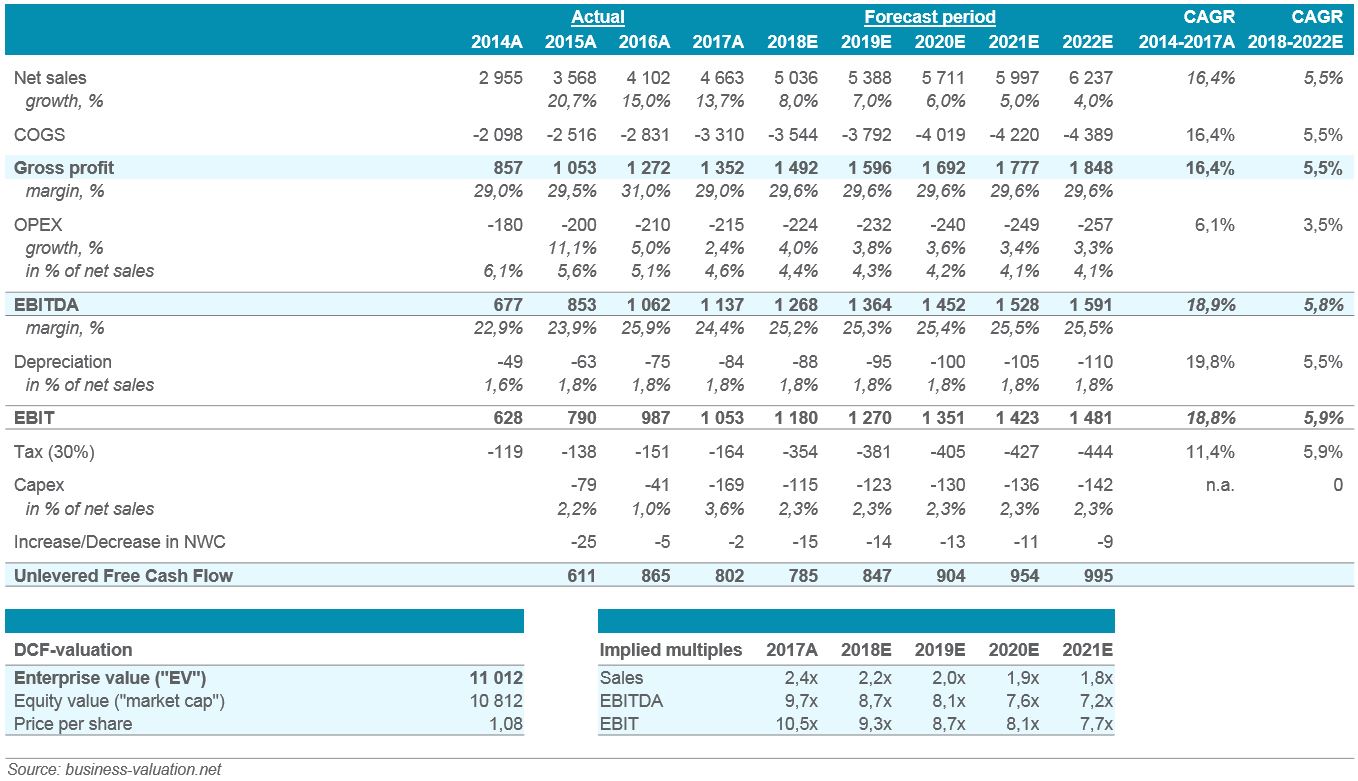
Discounted cash flow (DCF) analysis is a powerful tool with a wide range of applications in finance and business. By applying the formula for discounted cash flow in Excel, investors and analysts can evaluate investment opportunities, value companies, and determine the feasibility of projects. For instance, when evaluating an investment opportunity, DCF analysis can help estimate the present value of future cash flows, allowing investors to determine whether the investment is worth pursuing. In company valuation, DCF analysis can be used to estimate the intrinsic value of a company, providing a more accurate picture of its worth than traditional methods. Additionally, DCF analysis can be used to determine the feasibility of projects, such as infrastructure development or product launches, by estimating the present value of future cash flows and comparing it to the initial investment. By applying DCF analysis in these real-world scenarios, businesses and investors can make more informed decisions and drive growth.
Common Mistakes to Avoid in DCF Analysis
When performing discounted cash flow (DCF) analysis in Excel, it’s essential to avoid common mistakes that can lead to inaccurate results. One of the most critical mistakes is using an incorrect discount rate, which can significantly impact the present value of future cash flows. Another common mistake is inconsistent cash flow projections, which can lead to inaccurate estimates of future cash flows. Additionally, ignoring risk factors, such as market volatility or regulatory changes, can also lead to inaccurate results. Furthermore, failing to consider the time value of money, which is a fundamental concept in the formula for discounted cash flow in Excel, can also lead to errors. By being aware of these common mistakes, investors and analysts can ensure accurate DCF analysis and make informed decisions. It’s also important to regularly review and update DCF models to ensure that they remain relevant and accurate.
Using Excel Functions to Simplify DCF Calculations
When performing discounted cash flow (DCF) analysis in Excel, using built-in functions can simplify the calculation process and improve accuracy. Two essential functions for DCF analysis are XNPV and XIRR. The XNPV function calculates the present value of a series of cash flows, taking into account the discount rate and the timing of the cash flows. This function is particularly useful when working with irregular cash flow patterns. The XIRR function, on the other hand, calculates the internal rate of return (IRR) of a series of cash flows, which is essential for evaluating investment opportunities. By leveraging these functions, investors and analysts can streamline their DCF calculations and focus on interpreting the results. For instance, when using the formula for discounted cash flow in Excel, the XNPV function can be used to calculate the present value of future cash flows, while the XIRR function can be used to determine the IRR of an investment. By combining these functions with a solid understanding of DCF analysis, investors and analysts can make more informed decisions and drive business growth.
Best Practices for Implementing DCF Analysis in Excel
When implementing discounted cash flow (DCF) analysis in Excel, it’s essential to follow best practices to ensure accurate and reliable results. One key practice is to organize data in a clear and concise manner, using separate columns for cash flows, discount rates, and time periods. This will make it easier to construct the formula for discounted cash flow in Excel and reduce errors. Another best practice is to use Excel’s built-in functions, such as XNPV and XIRR, to simplify DCF calculations and improve accuracy. Additionally, it’s crucial to carefully construct formulas and ensure that they are correctly referencing the relevant data. When interpreting results, it’s essential to consider the assumptions and limitations of the DCF model and to perform sensitivity analysis to test the robustness of the results. By following these best practices, investors and analysts can ensure that their DCF analysis is accurate, reliable, and informative, and make more informed decisions. Furthermore, it’s important to regularly review and update DCF models to ensure that they remain relevant and accurate, and to incorporate new data and insights as they become available.


