What is Variance in Statistics?
In statistics, variance is a measure of the spread or dispersion of a dataset, quantifying how much individual data points deviate from the mean value. It is a crucial concept in understanding data distribution and is widely used in various fields, including finance, engineering, and social sciences. For instance, in finance, variance is used to calculate the risk of an investment portfolio, while in engineering, it is used to optimize system performance. In social sciences, variance helps researchers understand the diversity of opinions and behaviors within a population. Understanding variance is essential in making informed decisions, as it provides valuable insights into the uncertainty and volatility of a dataset.

Click Image to Find Quantum Products
Can Variance Ever Be Negative?
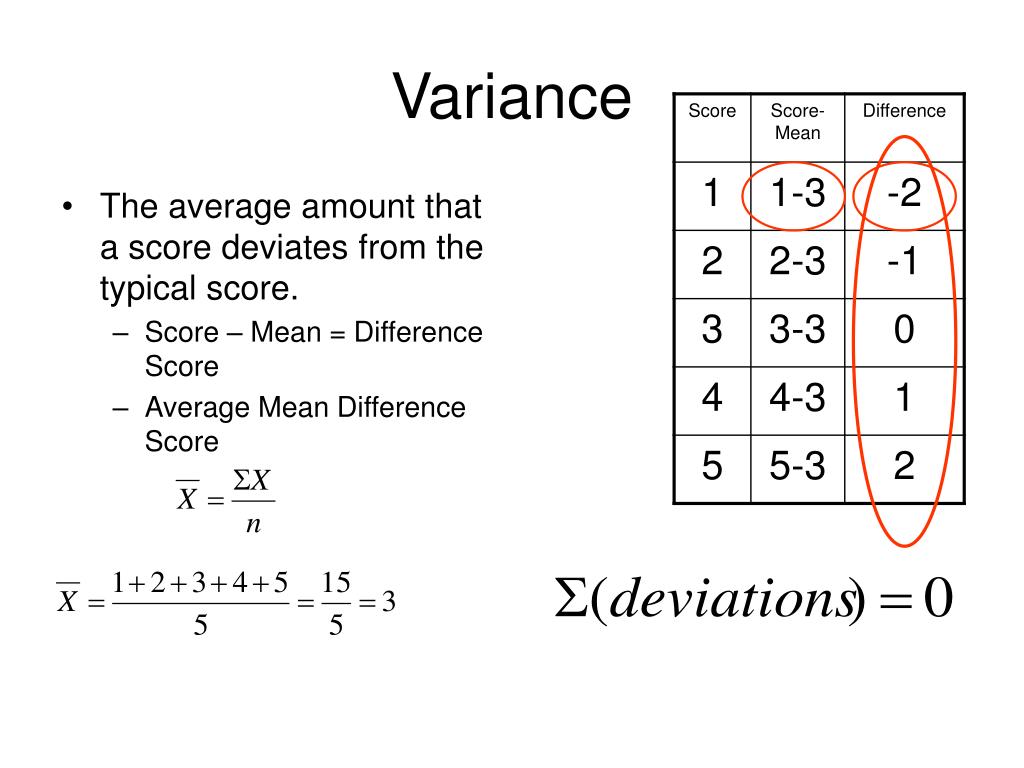
The question of whether the variance of a data set can ever be negative is a common point of confusion among data analysts and statisticians. The short answer is no, variance cannot be negative. This is because variance is a measure of the spread or dispersion of a dataset, and it is calculated as the average of the squared differences between each data point and the mean. Since the squared differences are always positive (or zero), the variance is always non-negative. In other words, the variance of a data set can be zero (if all data points are equal to the mean) or positive (if there is any variation in the data), but it can never be negative. This is a fundamental property of variance that is essential to understand in order to accurately interpret and analyze data.
The Consequences of Negative Variance
Although it is not possible for the variance of a data set to be negative, it is essential to discuss the implications of such a scenario. If a data analyst were to incorrectly calculate a negative variance, it could lead to severe consequences in data analysis. For instance, a negative variance would suggest that the data points are more concentrated around the mean than they actually are, which could result in underestimating the risk or uncertainty associated with the data. This, in turn, could lead to poor decision-making, as the analyst may not account for the full range of possible outcomes. Furthermore, a negative variance would also imply that the data is more consistent than it actually is, which could lead to a false sense of security or stability. In reality, a negative variance is a mathematical impossibility, and any calculation that yields a negative result is likely due to an error in the calculation or an incorrect understanding of the concept. Therefore, it is crucial to understand the correct calculation of variance and to be aware of the potential consequences of incorrect calculations.
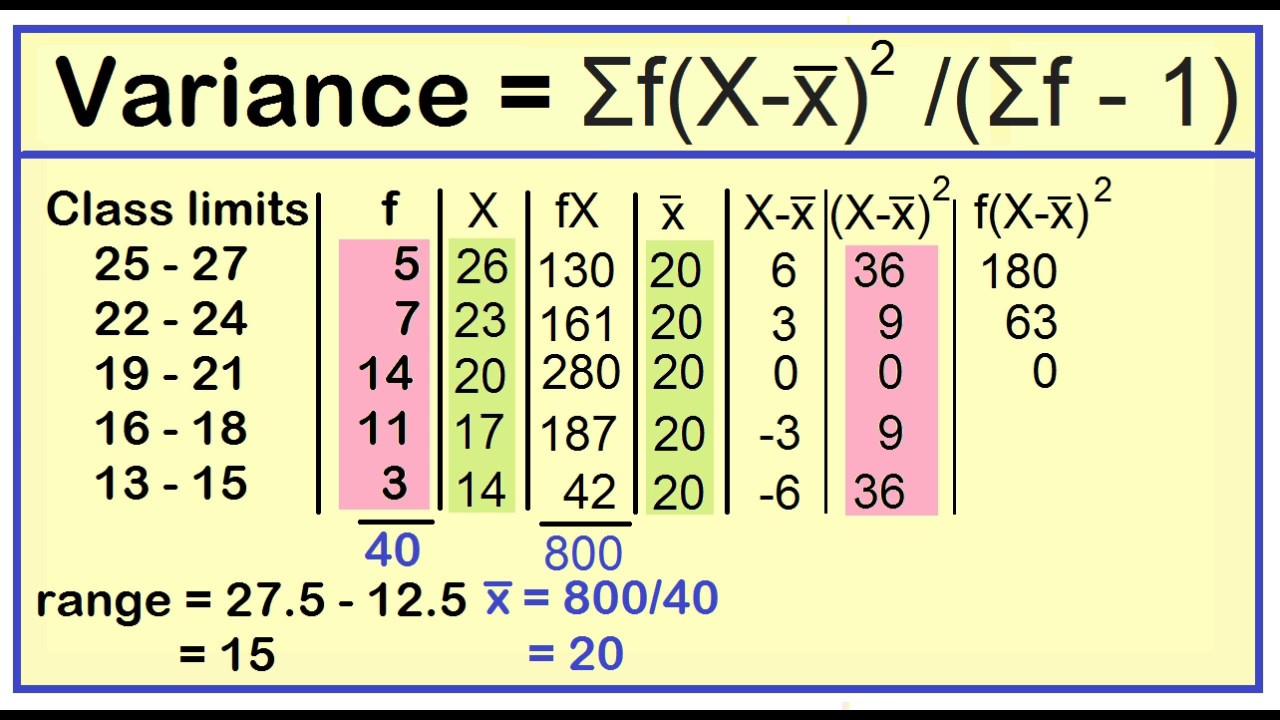
How to Calculate Variance Correctly
Calculating variance correctly is crucial in data analysis, as it provides a measure of the spread or dispersion of a dataset. To calculate variance, follow these steps:
1. Calculate the mean of the dataset: μ = (Σx) / n, where μ is the mean, Σx is the sum of the data points, and n is the number of data points.
2. Calculate the deviations of each data point from the mean: xi – μ, where xi is each data point.
3. Square each deviation: (xi – μ)^2.
4. Calculate the sum of the squared deviations: Σ(xi – μ)^2.
5. Divide the sum of the squared deviations by the number of data points minus one (n-1): σ^2 = Σ(xi – μ)^2 / (n-1), where σ^2 is the variance.
For example, let’s say we have a dataset of exam scores: 80, 70, 90, 85, 75. To calculate the variance, first, calculate the mean: μ = (80 + 70 + 90 + 85 + 75) / 5 = 84. Then, calculate the deviations from the mean: (-4, -14, 6, 1, -9). Square each deviation: (16, 196, 36, 1, 81). Calculate the sum of the squared deviations: 16 + 196 + 36 + 1 + 81 = 330. Finally, divide the sum by the number of data points minus one: σ^2 = 330 / (5-1) = 82.5.
It’s essential to use the correct formula and avoid common mistakes, such as dividing by n instead of n-1, which can lead to an underestimate of the variance. By following these steps, you can ensure accurate variance calculation and make informed decisions in data analysis.
Common Misconceptions About Variance
Despite its importance in data analysis, variance is often misunderstood, leading to misconceptions and errors. One of the most common misconceptions is that the variance of a data set can be negative. However, as we’ve established earlier, this is mathematically impossible. The variance of a data set is always non-negative, and any calculation that yields a negative result is likely due to an error in the calculation or an incorrect understanding of the concept.
Another misconception is that variance is only useful for understanding the spread of a dataset, but not for making predictions or identifying patterns. This is not entirely true. Variance plays a crucial role in statistical modeling and machine learning, where it is used to quantify the uncertainty associated with predictions and identify patterns in the data.
Some people also believe that variance is only relevant for large datasets, but this is not the case. Variance is an important measure of dispersion for datasets of all sizes, and it can provide valuable insights into the underlying structure of the data, even with small samples.
It’s essential to address these misconceptions and clarify any misunderstandings about variance. By doing so, we can ensure that data analysts and researchers use variance correctly and make informed decisions based on accurate calculations. Remember, the variance of a data set can never be negative, and it’s crucial to use the correct formula and avoid common mistakes to get accurate results.
:max_bytes(150000):strip_icc()/Variance-TAERM-ADD-V1-273ddd88c8c441d1b47f4f8f452f47b8.jpg)
Variance in Real-World Applications
Variance plays a crucial role in various real-world applications, where it helps make informed decisions and drive business outcomes. In finance, variance is used to quantify the risk associated with investments and portfolios. For instance, a stock with high variance is considered riskier than one with low variance, as its returns are more unpredictable. This information helps investors make informed decisions about their investments.
In engineering, variance is used to optimize system performance and reliability. By analyzing the variance of a system’s output, engineers can identify areas of improvement and make adjustments to reduce errors and increase efficiency. For example, in manufacturing, variance is used to monitor the quality of products and identify defects, enabling companies to improve their production processes.
In social sciences, variance is used to understand the spread of social and economic phenomena. For instance, in education, variance is used to analyze the performance of students and identify areas where they need improvement. This information helps educators develop targeted interventions to improve student outcomes.
In addition, variance is used in quality control, where it helps monitor the consistency of products and services. In healthcare, variance is used to analyze the effectiveness of treatments and identify areas for improvement. In marketing, variance is used to understand customer behavior and preferences, enabling companies to develop targeted marketing campaigns.
In all these applications, accurate variance calculation is essential to make informed decisions. A thorough understanding of variance helps professionals identify patterns and trends, quantify risk, and optimize performance. By recognizing the importance of variance in real-world applications, we can unlock its potential to drive business outcomes and improve decision-making.
The Role of Variance in Data Analysis
Variance plays a vital role in data analysis, serving as a fundamental measure of dispersion and spread. It is closely related to other statistical measures, such as standard deviation and mean, which are used to understand the characteristics of a dataset. In data analysis, variance is used to identify patterns and trends, quantify uncertainty, and make predictions.
One of the key applications of variance is in hypothesis testing, where it is used to determine the significance of a result. By calculating the variance of a sample, researchers can determine whether the observed difference is due to chance or a real effect. This is particularly important in fields like medicine, social sciences, and business, where accurate predictions and decisions are crucial.
Variance is also used in regression analysis, where it helps to quantify the uncertainty associated with predictions. By analyzing the variance of the residuals, researchers can identify the strength of the relationship between variables and make more accurate predictions. This is essential in fields like finance, engineering, and economics, where accurate predictions can have a significant impact on decision-making.
Furthermore, variance is used in data visualization, where it helps to create informative and effective plots. By understanding the variance of a dataset, researchers can create plots that effectively communicate the underlying patterns and trends, enabling more informed decision-making.
It’s worth noting that the concept of variance is often misunderstood, with some believing that can the variance of a data set ever be negative. However, as we’ve established earlier, this is mathematically impossible. Variance is always non-negative, and any calculation that yields a negative result is likely due to an error in the calculation or an incorrect understanding of the concept.
In conclusion, variance is a fundamental concept in data analysis, playing a crucial role in identifying patterns and trends, quantifying uncertainty, and making predictions. By understanding the role of variance in data analysis, researchers and professionals can make more informed decisions and drive business outcomes.
Conclusion: The Importance of Accurate Variance Calculation
In conclusion, accurate variance calculation is crucial in data analysis, as it provides a comprehensive understanding of data dispersion and spread. The importance of variance cannot be overstated, as it is used in various real-world applications, such as finance, engineering, and social sciences, to make informed decisions.
It is essential to remember that can the variance of a data set ever be negative is a misconception that can lead to errors and misinterpretations in data analysis. Variance is always non-negative, and any calculation that yields a negative result is likely due to an error in the calculation or an incorrect understanding of the concept.
By understanding the role of variance in data analysis, researchers and professionals can make more informed decisions and drive business outcomes. Accurate variance calculation is critical in identifying patterns and trends, quantifying uncertainty, and making predictions.
In today’s data-driven world, the importance of accurate variance calculation cannot be overstated. With the increasing amount of data being generated, it is essential to have a thorough understanding of variance to make informed decisions. By recognizing the importance of accurate variance calculation, professionals can unlock the potential of data analysis and drive business outcomes.
In summary, accurate variance calculation is vital in data analysis, and its importance cannot be overstated. By understanding the role of variance and its applications, professionals can make more informed decisions and drive business outcomes.