Understanding the Concept of Value at Risk
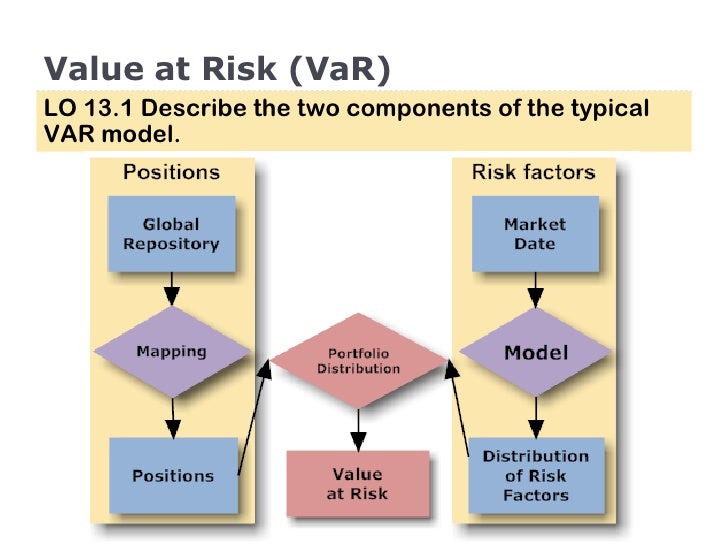
Value at Risk (VaR) is a crucial metric in risk management, used to quantify the potential loss of a portfolio over a specific time horizon with a given probability. The question “how do you calculate var” is a common one in the finance industry, and understanding the answer is vital for investors, financial institutions, and corporations. VaR is widely used in various industries, including finance, banking, and investment, to assess and manage risk. By grasping the concept of VaR, individuals and organizations can better navigate the complex world of risk management and make more informed investment decisions. In essence, VaR helps to answer questions such as “what is the potential loss of my portfolio?” and “how do I mitigate potential losses?”
The Different Methods of Calculating VaR
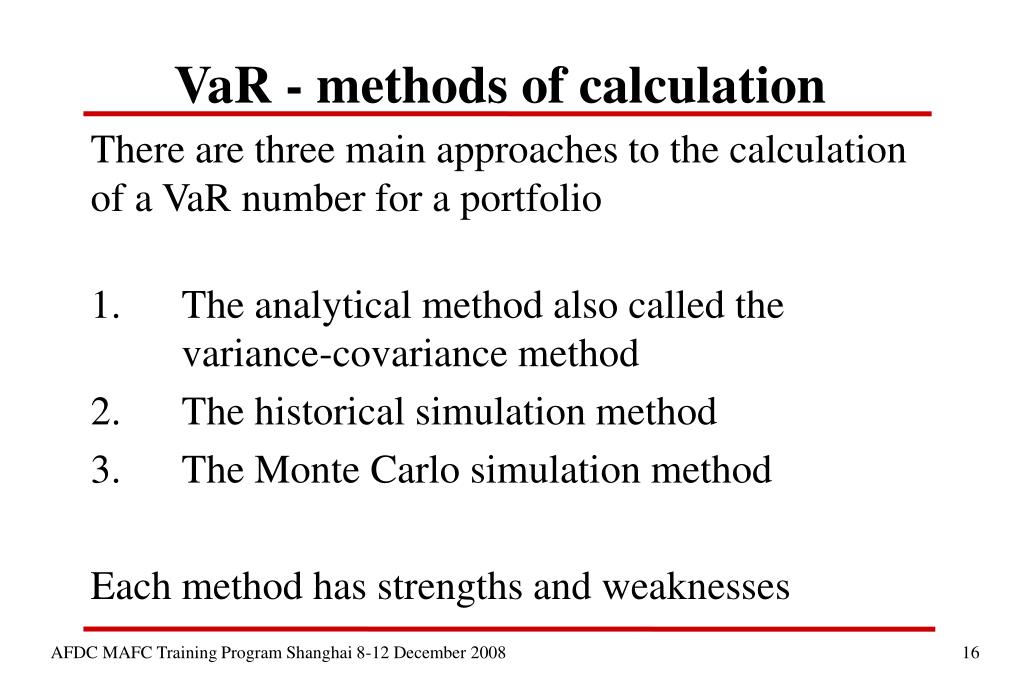
When it comes to calculating Value at Risk (VaR), there are three main methods used in the finance industry: the Variance-Covariance method, Historical Simulation method, and Monte Carlo Simulation method. Each method has its own strengths and weaknesses, and understanding the differences between them is crucial for accurate VaR calculation. The question “how do you calculate var” can be answered in different ways, depending on the chosen method. The Variance-Covariance method is a parametric approach that assumes normal distribution of returns, while the Historical Simulation method is a non-parametric approach that uses historical data to estimate potential losses. The Monte Carlo Simulation method, on the other hand, is a more advanced approach that uses random simulations to estimate potential losses. By understanding the different methods of calculating VaR, individuals and organizations can choose the most suitable approach for their specific needs and make more informed investment decisions.
How to Calculate VaR Using the Variance-Covariance Method
The Variance-Covariance method is a popular approach to calculating Value at Risk (VaR), and it’s essential to understand how to apply it correctly. The question “how do you calculate var” can be answered by following a step-by-step guide to VaR calculation using this method. To calculate VaR using the Variance-Covariance method, you’ll need to follow these steps:
Step 1: Calculate the portfolio’s expected return and volatility. This can be done using historical data or by using a financial model.
Step 2: Determine the confidence level and time horizon for the VaR calculation. A common confidence level is 95%, and the time horizon is typically one day.
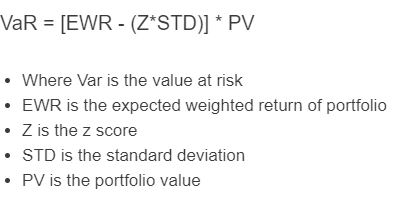
Step 3: Calculate the portfolio’s VaR using the following formula: VaR = Z \* σ \* √(Δt), where Z is the Z-score corresponding to the confidence level, σ is the portfolio’s volatility, and Δt is the time horizon.
For example, let’s say you have a portfolio with an expected return of 10% and a volatility of 15%. If you want to calculate the VaR at a 95% confidence level over a one-day time horizon, you would use a Z-score of 1.645. Plugging in the numbers, you get: VaR = 1.645 \* 0.15 \* √(1) = 0.0247, or 2.47%.
This means that there is a 5% chance that the portfolio will lose more than 2.47% of its value over a one-day period. By understanding how to calculate VaR using the Variance-Covariance method, individuals and organizations can better manage their risk and make more informed investment decisions.
Calculating VaR with Historical Simulation: A Practical Approach
The Historical Simulation method is a popular approach to calculating Value at Risk (VaR), and it’s essential to understand how to apply it correctly. The question “how do you calculate var” can be answered by following a step-by-step guide to VaR calculation using this method. To calculate VaR using Historical Simulation, you’ll need to follow these steps:
Step 1: Collect historical data on the portfolio’s returns over a specific time period. This data should be representative of the portfolio’s potential losses.
Step 2: Order the returns in descending order, from largest loss to smallest loss.
Step 3: Calculate the VaR by selecting the return that corresponds to the desired confidence level. For example, if you want to calculate the VaR at a 95% confidence level, you would select the 5th percentile of the returns.
For example, let’s say you have a portfolio with a historical return series of -5%, -3%, -2%, 0%, 2%, 3%, and 5%. If you want to calculate the VaR at a 95% confidence level, you would select the 5th percentile of the returns, which is -3%. This means that there is a 5% chance that the portfolio will lose more than 3% of its value over a one-day period.
The Historical Simulation method has several advantages, including its simplicity and ability to capture non-normal distributions. However, it also has some limitations, such as its reliance on historical data and its potential to be sensitive to outliers. By understanding how to calculate VaR using Historical Simulation, individuals and organizations can better manage their risk and make more informed investment decisions.
Monte Carlo Simulation: A More Advanced Approach to VaR Calculation
The Monte Carlo Simulation method is a more advanced approach to calculating Value at Risk (VaR), offering a high degree of accuracy and flexibility. This method involves simulating multiple scenarios of potential losses using random sampling, allowing for a more comprehensive understanding of potential risks. When asking “how do you calculate var”, the Monte Carlo Simulation method provides a sophisticated answer.
The process of calculating VaR using Monte Carlo Simulation involves several steps:
Step 1: Define the probability distribution of the portfolio’s returns, taking into account factors such as volatility, correlation, and skewness.
Step 2: Generate a large number of random scenarios using Monte Carlo methods, simulating potential losses and gains.
Step 3: Calculate the VaR by selecting the return that corresponds to the desired confidence level, such as the 5th percentile of the simulated returns.
The Monte Carlo Simulation method has several advantages, including its ability to handle complex distributions and non-linear relationships. Additionally, it allows for the incorporation of multiple risk factors and stress testing scenarios. However, it also has some limitations, such as requiring significant computational power and being sensitive to model assumptions.
For example, let’s say you want to calculate the VaR of a portfolio using Monte Carlo Simulation. You define the probability distribution of the returns, generate 10,000 random scenarios, and calculate the VaR at a 95% confidence level. The result may indicate that there is a 5% chance that the portfolio will lose more than 2.5% of its value over a one-day period.
By understanding how to calculate VaR using Monte Carlo Simulation, individuals and organizations can gain a more nuanced understanding of their risk exposure and make more informed investment decisions. This method is particularly useful for complex portfolios and scenarios where traditional methods may not be sufficient.
Interpreting VaR Results: What Do the Numbers Mean?
Once you’ve calculated Value at Risk (VaR) using one of the methods discussed earlier, it’s essential to understand how to interpret the results. Interpreting VaR results correctly is crucial for making informed investment decisions and managing risk effectively. When asking “how do you calculate var”, it’s equally important to know how to interpret the results.
The VaR number represents the potential loss of a portfolio over a specific time horizon with a given probability. For example, a VaR of 2% at a 95% confidence level means that there is a 5% chance that the portfolio will lose more than 2% of its value over a one-day period.
To interpret VaR results, consider the following factors:
Confidence level: A higher confidence level indicates a lower probability of exceeding the VaR threshold. For instance, a 99% confidence level implies a 1% chance of exceeding the VaR threshold.
Time horizon: The VaR calculation is typically performed over a specific time horizon, such as a day or a week. The longer the time horizon, the higher the potential loss.
Portfolio composition: The VaR result is sensitive to the composition of the portfolio, including the assets, weights, and correlations.
When interpreting VaR results, it’s essential to consider the following questions:
What is the probability of exceeding the VaR threshold?
What is the potential loss if the VaR threshold is exceeded?
How does the VaR result change with different confidence levels or time horizons?
By understanding how to interpret VaR results, individuals and organizations can make more informed investment decisions, adjust their risk management strategies, and optimize their portfolio performance.
Common Pitfalls to Avoid When Calculating VaR
When calculating Value at Risk (VaR), it’s essential to avoid common pitfalls that can lead to inaccurate results and poor risk management decisions. Understanding how to calculate VaR is crucial, but it’s equally important to be aware of the potential mistakes that can occur during the calculation process.
Data quality issues are a common pitfall when calculating VaR. Poor data quality can lead to inaccurate VaR results, which can have significant consequences for investment decisions and risk management strategies. It’s essential to ensure that the data used for VaR calculation is accurate, complete, and relevant.
Model risk is another pitfall to avoid when calculating VaR. Model risk refers to the potential errors or biases in the VaR model, which can lead to inaccurate results. It’s essential to validate the VaR model regularly and ensure that it’s robust and reliable.
Incorrect assumptions are also a common pitfall when calculating VaR. Incorrect assumptions about market conditions, volatility, or correlations can lead to inaccurate VaR results. It’s essential to ensure that the assumptions used in the VaR calculation are realistic and based on empirical evidence.
Other common pitfalls to avoid when calculating VaR include:
Inadequate risk modeling: Failing to capture the complexity of the portfolio’s risk profile can lead to inaccurate VaR results.
Incomplete data: Failing to include all relevant data in the VaR calculation can lead to inaccurate results.
Over-reliance on historical data: Failing to consider forward-looking scenarios and relying solely on historical data can lead to inaccurate VaR results.
By being aware of these common pitfalls, individuals and organizations can avoid making critical mistakes when calculating VaR and ensure that their risk management strategies are effective and reliable. Remember, understanding how to calculate VaR is only half the battle; avoiding common pitfalls is equally important for achieving accurate results.
Best Practices for Implementing VaR in Your Organization
Implementing Value at Risk (VaR) in an organization requires a structured approach to ensure accurate and reliable results. By following best practices, organizations can effectively integrate VaR into their risk management framework and make informed investment decisions. When considering how to calculate VaR, it’s essential to implement it correctly in your organization.
Data Management: A crucial aspect of implementing VaR is data management. Organizations should ensure that they have access to high-quality, relevant, and accurate data. This includes historical data, market data, and other relevant information. A robust data management system can help organizations to store, process, and analyze large datasets efficiently.
Model Validation: Validating the VaR model is critical to ensure that it’s robust and reliable. Organizations should regularly validate their VaR model using different scenarios, stress tests, and backtesting. This helps to identify any potential biases or errors in the model and ensures that it’s accurately capturing the risk profile of the portfolio.
Ongoing Monitoring: VaR is not a one-time calculation; it requires ongoing monitoring and updating. Organizations should regularly review and update their VaR calculations to reflect changes in market conditions, portfolio composition, and other factors. This helps to ensure that the VaR results remain accurate and relevant.
Other best practices for implementing VaR in an organization include:
Establishing a clear risk management framework: This helps to ensure that VaR is integrated into the organization’s overall risk management strategy.
Defining clear roles and responsibilities: This helps to ensure that everyone involved in the VaR calculation process understands their role and responsibilities.
Providing ongoing training and education: This helps to ensure that staff involved in VaR calculation have the necessary skills and knowledge to perform the calculation accurately.
By following these best practices, organizations can ensure that they’re getting the most out of their VaR calculations and making informed investment decisions. Remember, understanding how to calculate VaR is only the first step; implementing it correctly in your organization is equally important.


