Unlocking the Secrets of the Treasury Yield Curve
Navigating the Complex World of Government Bonds
The treasury yield curve is a crucial component of the financial market, playing a vital role in shaping the economy and influencing investment decisions. It represents the relationship between the yield on government bonds and their respective maturity dates, providing valuable insights into the market’s expectations of future interest rates and economic trends. The yield curve’s importance extends to both investors and economists, as it serves as a benchmark for fixed-income investments and informs monetary policy decisions. A deep understanding of the treasury yield curve is essential for navigating the complex world of government bonds, where subtle changes in the curve can have significant implications for investment strategies and economic outcomes.
What is the 5 Year Treasury Forward Curve and Why Does it Matter?
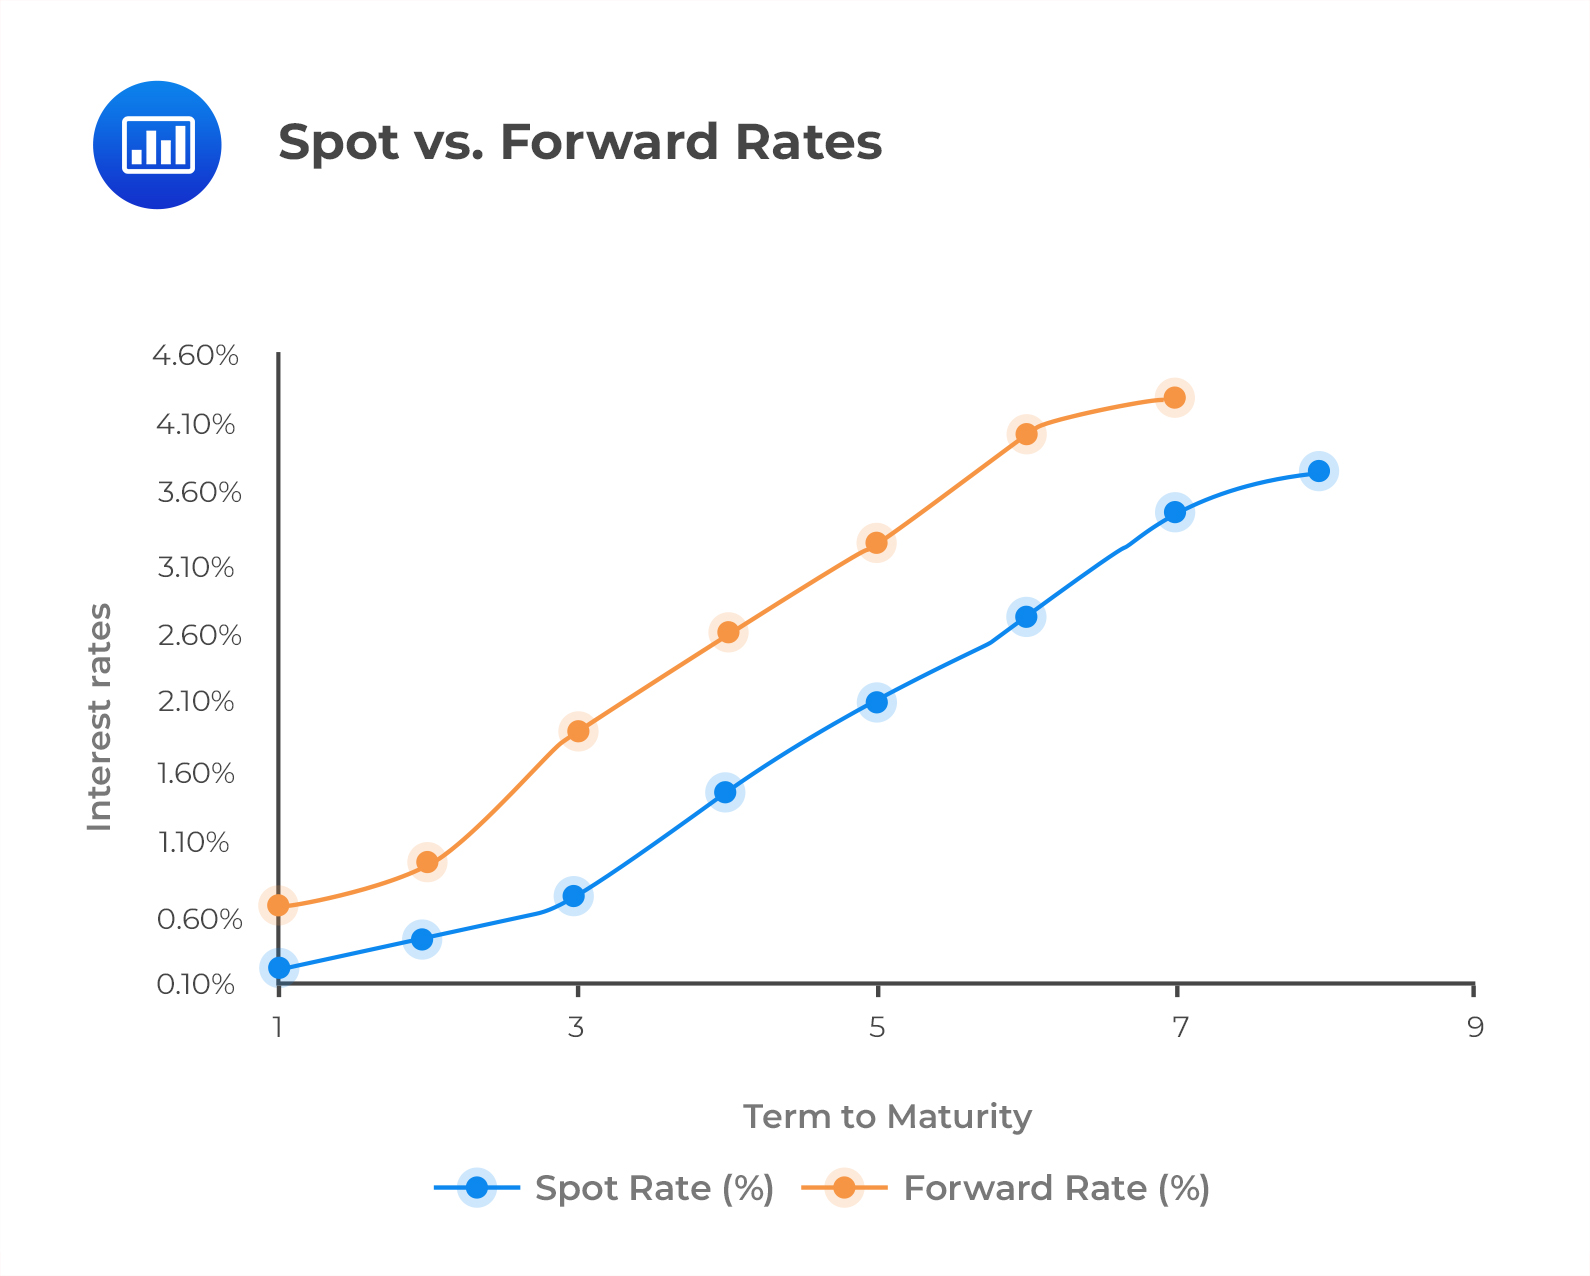
The 5 year treasury forward curve is a critical component of the treasury yield curve, providing valuable insights into the market’s expectations of future interest rates and economic trends. It represents the implied forward rates on 5-year treasury notes, calculated from the current yield curve. This forward curve is significant because it helps investors and economists anticipate future interest rate changes, allowing them to make informed investment decisions and adjust their strategies accordingly. By analyzing the 5 year treasury forward curve, market participants can gain a better understanding of the market’s expectations of future economic conditions, including inflation, growth, and monetary policy decisions.
How to Analyze the 5 Year Treasury Forward Curve for Investment Insights
To unlock the secrets of the 5 year treasury forward curve, investors and economists must develop a systematic approach to analyzing this critical component of the treasury yield curve. Here’s a step-by-step guide to help you get started:
Step 1: Obtain the latest 5 year treasury forward curve data from reputable sources, such as the U.S. Department of the Treasury or financial data providers.
Step 2: Plot the 5 year treasury forward curve to visualize the implied forward rates and identify trends, patterns, and anomalies.
Step 3: Analyze the slope of the 5 year treasury forward curve to determine whether the market is expecting rising or falling interest rates in the future.
Step 4: Identify inflection points or kinks in the curve, which may indicate changes in market sentiment or shifts in the economic outlook.
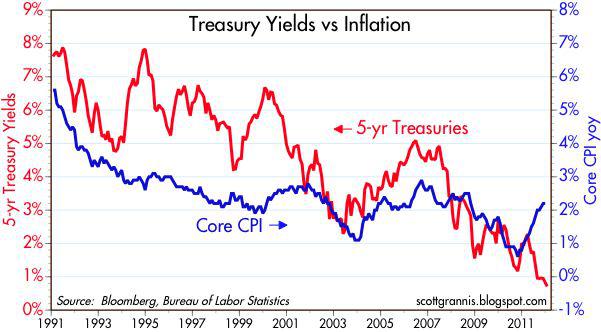
Step 5: Compare the 5 year treasury forward curve with other market indicators, such as the yield curve, inflation expectations, and economic indicators, to gain a more comprehensive understanding of the market’s expectations.
By following these steps, investors and economists can gain valuable insights into the market’s expectations of future interest rates and economic trends, enabling them to make informed investment decisions and adjust their strategies accordingly.
The Relationship Between the 5 Year Treasury Forward Curve and Economic Indicators
The 5 year treasury forward curve is closely tied to key economic indicators, providing valuable insights into the market’s expectations of future economic trends. By analyzing the correlation between the 5 year treasury forward curve and economic indicators, investors and economists can gain a deeper understanding of the complex relationships between interest rates, inflation, growth, and employment.
One of the most significant correlations is between the 5 year treasury forward curve and GDP growth. When the curve is steepening, it often indicates expectations of stronger economic growth, while a flattening curve may suggest slower growth or even recession. Similarly, the curve’s slope is also closely tied to inflation expectations, with a steeper curve indicating higher inflation expectations and a flatter curve suggesting lower inflation expectations.
The 5 year treasury forward curve also has a strong correlation with unemployment rates. When the curve is steepening, it often indicates expectations of lower unemployment rates, while a flattening curve may suggest higher unemployment rates. This correlation is particularly useful for investors and economists seeking to understand the labor market’s impact on interest rates and economic growth.
By analyzing the relationships between the 5 year treasury forward curve and these key economic indicators, investors and economists can develop a more comprehensive understanding of the market’s expectations and make informed investment decisions. By incorporating these insights into their analysis, they can better navigate the complex world of government bonds and optimize their investment strategies.
Using the 5 Year Treasury Forward Curve to Predict Interest Rate Changes
The 5 year treasury forward curve is a powerful tool for predicting changes in interest rates, allowing investors and economists to make informed investment decisions. By analyzing the curve’s shape and slope, market participants can gain valuable insights into the market’s expectations of future interest rate movements.
A steepening 5 year treasury forward curve, for example, may indicate expectations of rising interest rates in the future, while a flattening curve may suggest expectations of falling interest rates. This information can be used to adjust investment strategies, such as shifting from long-term to short-term bonds or vice versa, to take advantage of expected interest rate changes.
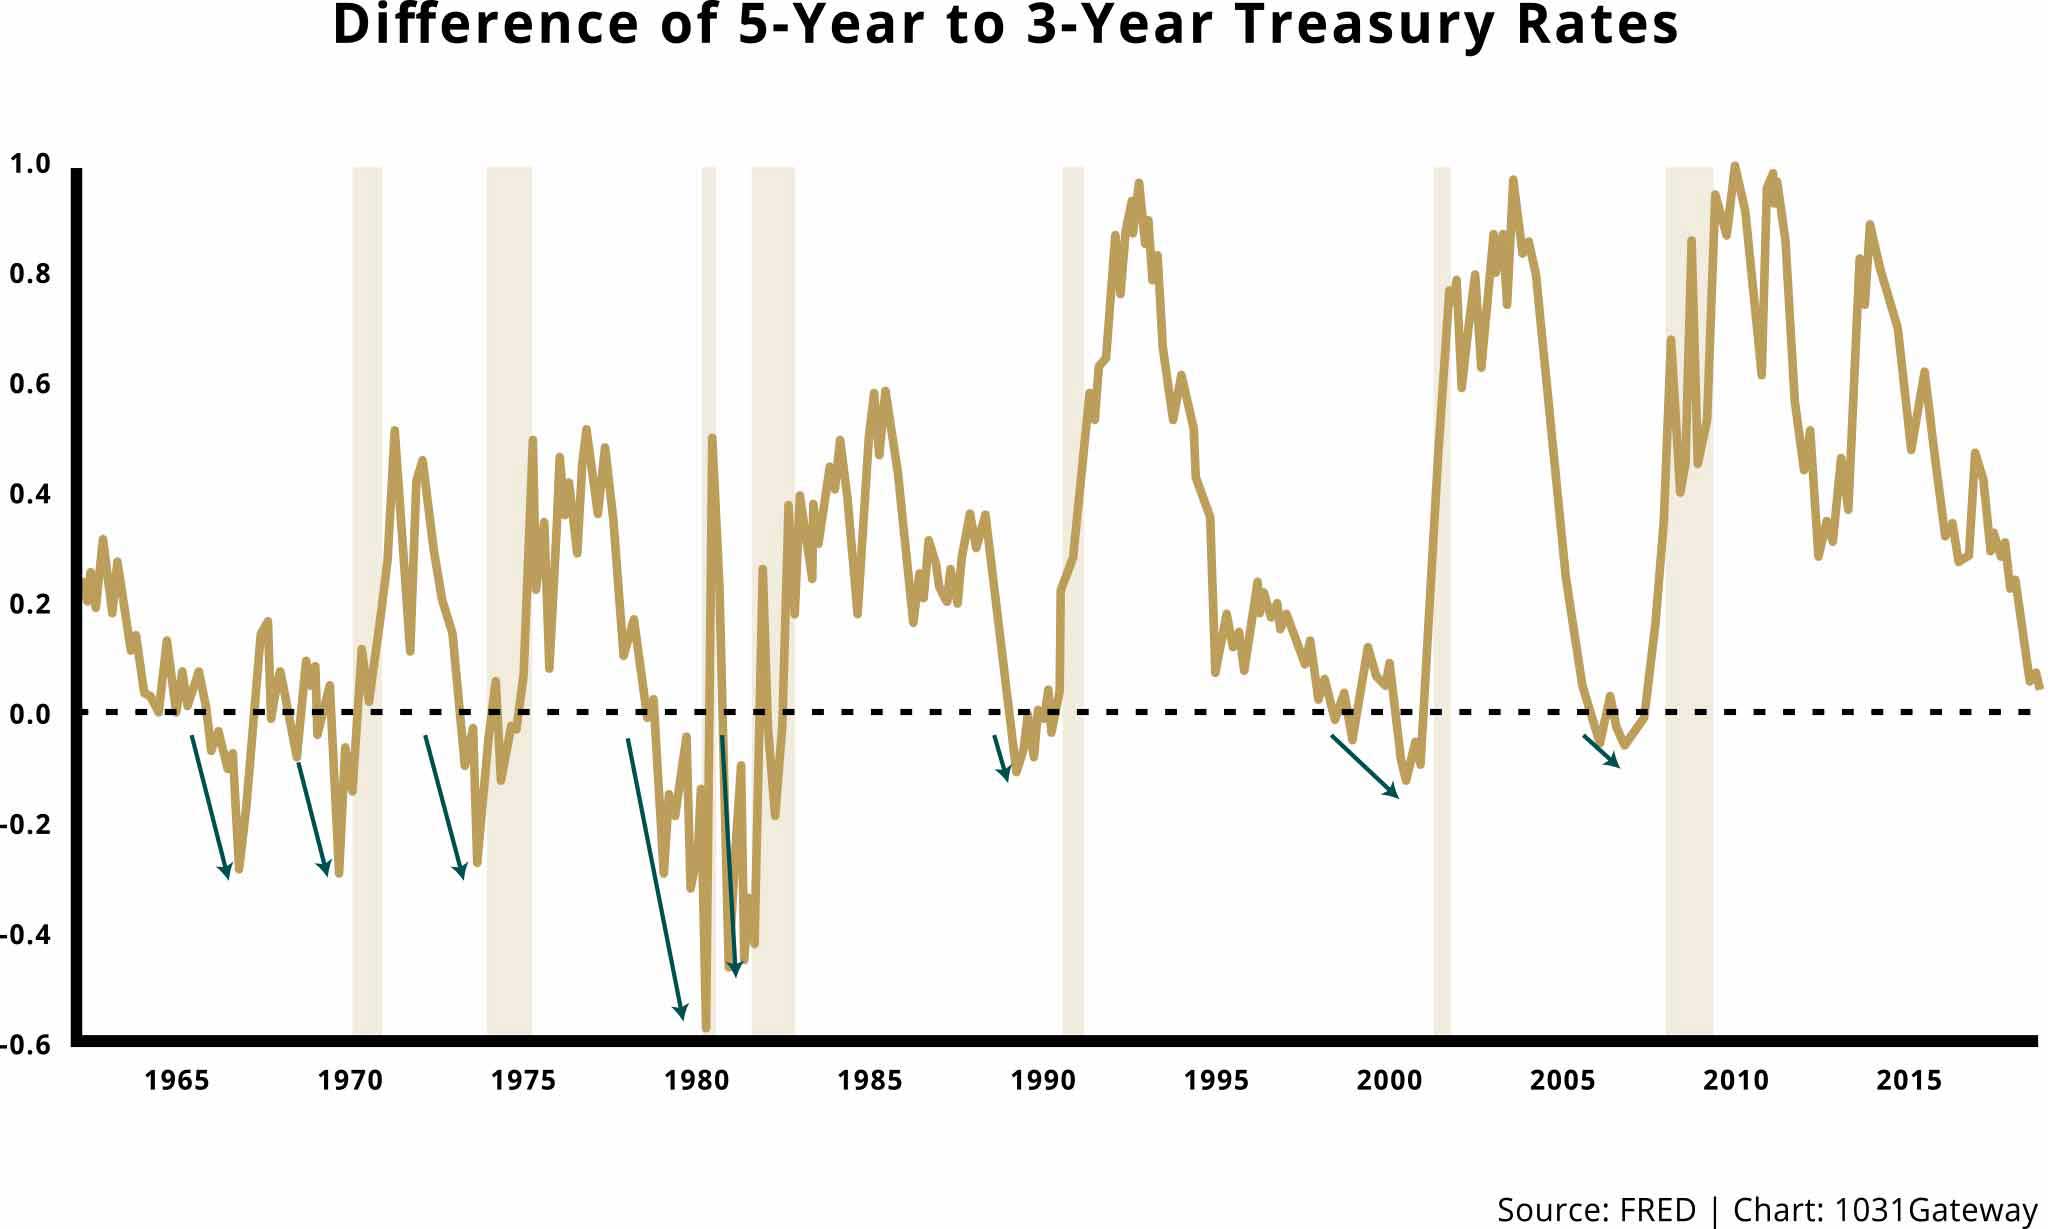
In addition, the 5 year treasury forward curve can be used to identify potential interest rate risks and opportunities. For instance, if the curve is inverted, with shorter-term rates higher than longer-term rates, it may indicate a higher likelihood of a recession, prompting investors to adjust their portfolios accordingly.
Furthermore, the 5 year treasury forward curve can be used in conjunction with other market indicators, such as the yield curve and economic indicators, to gain a more comprehensive understanding of the market’s expectations. By combining these insights, investors and economists can develop a more accurate forecast of future interest rate changes and make informed investment decisions.
For example, if the 5 year treasury forward curve is steepening and the yield curve is also steepening, it may indicate a strong expectation of rising interest rates, prompting investors to adjust their portfolios accordingly. Conversely, if the 5 year treasury forward curve is flattening and the yield curve is also flattening, it may indicate a weaker expectation of rising interest rates, leading investors to reassess their investment strategies.
Case Studies: How the 5 Year Treasury Forward Curve Impacted Investment Strategies
The 5 year treasury forward curve has played a significant role in shaping investment strategies in the past. By examining real-life examples of how the curve has influenced investment decisions, investors and economists can gain valuable insights into its predictive power.
One notable example is the 2007-2008 financial crisis. In the years leading up to the crisis, the 5 year treasury forward curve was flattening, indicating expectations of lower interest rates in the future. This prompted many investors to shift their portfolios towards longer-term bonds, anticipating lower yields. However, when the crisis hit, interest rates plummeted, and those who had adjusted their portfolios accordingly were able to mitigate their losses.
Another example is the 2013 “taper tantrum,” when the Federal Reserve announced its plans to scale back its quantitative easing program. The 5 year treasury forward curve steepened significantly in response, indicating expectations of higher interest rates. Investors who had anticipated this shift and adjusted their portfolios accordingly were able to capitalize on the subsequent rise in yields.
In contrast, there have also been instances where the 5 year treasury forward curve has led investors astray. For example, in 2019, the curve was flattening, indicating expectations of lower interest rates. However, the Federal Reserve unexpectedly cut interest rates, catching many investors off guard. Those who had adjusted their portfolios based on the curve’s signal were left exposed to losses.
These case studies demonstrate the importance of incorporating the 5 year treasury forward curve into investment strategies. By analyzing the curve’s signals and incorporating them into their decision-making process, investors and economists can gain a competitive edge in the market. However, it is also crucial to recognize the curve’s limitations and to combine its insights with other market indicators to make informed investment decisions.
The Role of the 5 Year Treasury Forward Curve in Portfolio Management
Incorporating the 5 year treasury forward curve into portfolio management is crucial for investors seeking to optimize returns and manage risk. By analyzing the curve’s signals, investors can gain valuable insights into future interest rate movements and adjust their portfolios accordingly.
One key benefit of incorporating the 5 year treasury forward curve into portfolio management is its ability to help manage interest rate risk. By identifying trends and patterns in the curve, investors can anticipate changes in interest rates and adjust their bond holdings to minimize losses or maximize gains. For example, if the curve is steepening, indicating expectations of rising interest rates, investors may choose to shift their portfolios towards shorter-term bonds to reduce their exposure to rising yields.
The 5 year treasury forward curve can also be used to optimize returns by identifying opportunities to invest in undervalued or overvalued bonds. By analyzing the curve’s signals, investors can identify mispricings in the bond market and take advantage of them to generate alpha. For instance, if the curve is flattening, indicating expectations of lower interest rates, investors may choose to invest in longer-term bonds to capitalize on the subsequent decline in yields.
In addition, the 5 year treasury forward curve can be used to inform asset allocation decisions. By analyzing the curve’s signals, investors can gain insights into the overall direction of the economy and adjust their asset allocations accordingly. For example, if the curve is steepening, indicating expectations of rising interest rates and economic growth, investors may choose to shift their portfolios towards equities to capitalize on the subsequent growth.
Overall, incorporating the 5 year treasury forward curve into portfolio management is essential for investors seeking to optimize returns and manage risk. By analyzing the curve’s signals and incorporating them into their decision-making process, investors can gain a competitive edge in the market and achieve their investment objectives.
Staying Ahead of the Curve: Tips for Tracking and Analyzing the 5 Year Treasury Forward Curve
To stay ahead of the curve, it’s essential to track and analyze the 5 year treasury forward curve regularly. Here are some practical tips and resources to help you do so:
Firstly, stay up-to-date with the latest data from reputable sources such as the U.S. Department of the Treasury, the Federal Reserve, and financial news websites. These sources provide daily updates on the 5 year treasury forward curve, allowing you to track changes and trends in real-time.
Secondly, use online tools and platforms that provide interactive charts and graphs to visualize the 5 year treasury forward curve. These tools enable you to identify trends, patterns, and anomalies more easily, and make it simpler to analyze the curve’s signals.
Thirdly, set up alerts and notifications to inform you of significant changes in the 5 year treasury forward curve. This can help you respond quickly to changes in interest rates and economic trends, and make informed investment decisions.
Fourthly, follow reputable economists, analysts, and financial experts on social media and online forums. These experts often provide valuable insights and analysis on the 5 year treasury forward curve, which can help you stay informed and ahead of the curve.
Fifthly, consider using machine learning and artificial intelligence tools to analyze the 5 year treasury forward curve. These tools can help identify complex patterns and trends in the curve, and provide more accurate predictions of future interest rate changes.
By following these tips and resources, you can stay ahead of the curve and make informed investment decisions based on the 5 year treasury forward curve. Remember to always stay vigilant and adapt to changes in the curve, and you’ll be well on your way to achieving your investment objectives.


