Why Geometric Mean Matters in Investment Analysis
Investment analysis relies heavily on accurate performance measurement to inform sound investment decisions. One crucial concept in this pursuit is the geometric mean rate of return, which provides a more accurate representation of investment performance over time. Unlike other methods, geometric mean rate of return takes into account the compounding effect of returns, offering a more realistic picture of an investment’s performance. By understanding how to calculate geometric mean rate of return, investors can gain a deeper insight into their investments and make more informed decisions. In this article, we will explore the significance of geometric mean rate of return and provide a comprehensive guide on how to calculate it, empowering investors to optimize their investment strategies.

Click Image to Find Quantum Products
Understanding the Difference between Arithmetic and Geometric Mean
In investment analysis, understanding the distinction between arithmetic mean and geometric mean is crucial for accurate performance measurement. The arithmetic mean, also known as the average return, is a simple calculation of the average of a series of returns. However, this method has significant limitations, as it does not take into account the compounding effect of returns over time. In contrast, the geometric mean rate of return provides a more accurate representation of investment performance by accounting for the compounding effect. This distinction is critical, as the arithmetic mean can overstate or understate the true performance of an investment. By grasping the differences between these two methods, investors can make more informed decisions and avoid potential pitfalls. In the next section, we will delve into the step-by-step process of how to calculate geometric mean rate of return, empowering investors to unlock the full potential of this powerful tool.
How to Calculate Geometric Mean Rate of Return: A Step-by-Step Guide
To calculate the geometric mean rate of return, follow these steps:
Step 1: Gather the necessary data, including the investment’s returns over a specific period. Ensure the returns are expressed as decimals, not percentages.
Step 2: Add 1 to each return, as the geometric mean formula requires this adjustment.
Step 3: Multiply the adjusted returns together to calculate the product of the returns.
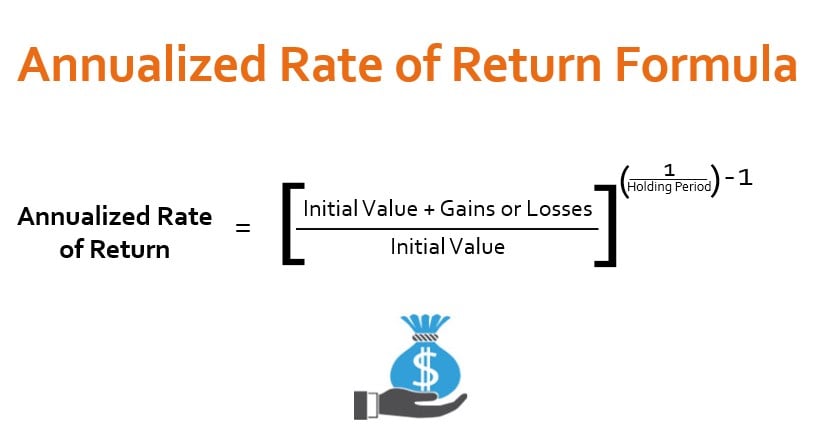
Step 4: Raise the product to the power of 1/n, where n is the number of periods. This will give you the geometric mean.
Step 5: Subtract 1 from the geometric mean to convert it back to a rate of return.
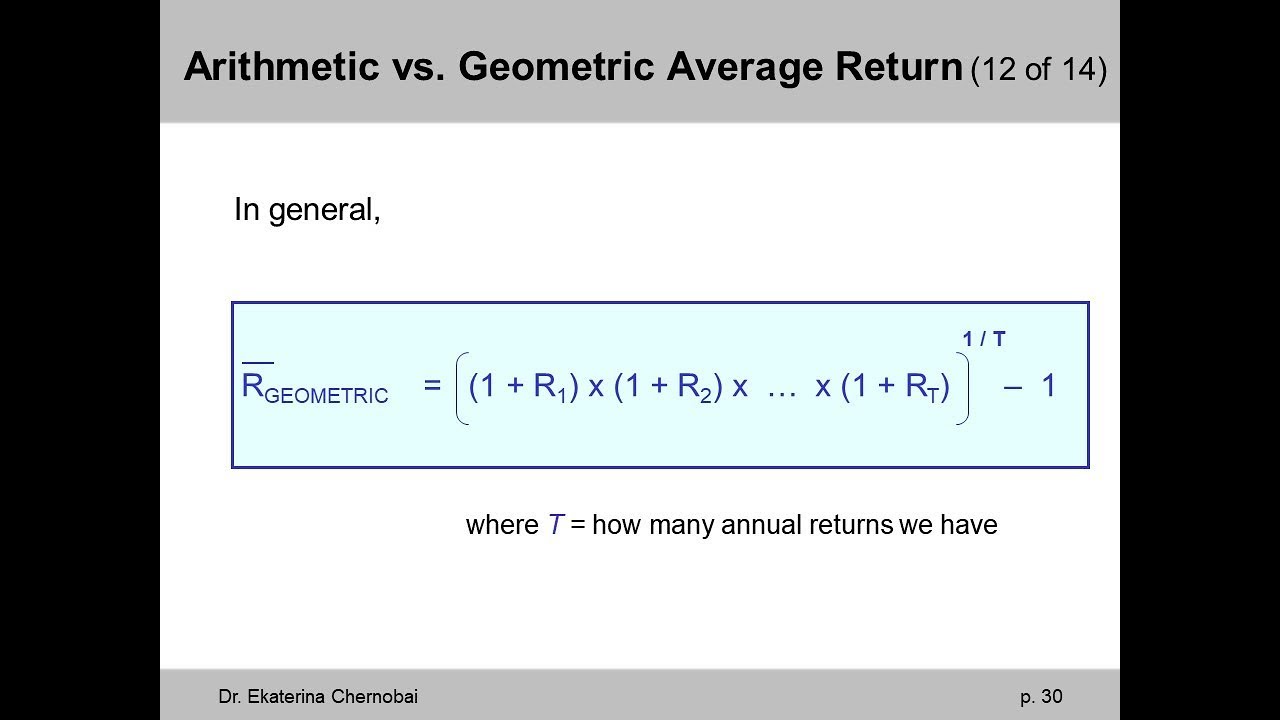
The formula for calculating geometric mean rate of return is:
(1 + r1) × (1 + r2) × … × (1 + rn) = (1 + GM)^n
Where ri is the return for period i, GM is the geometric mean rate of return, and n is the number of periods.
For example, let’s say you want to calculate the geometric mean rate of return for an investment with the following returns: 10%, 15%, and 8% over three years.
Using the formula, you would calculate the geometric mean rate of return as follows:
(1 + 0.10) × (1 + 0.15) × (1 + 0.08) = (1 + GM)^3
Solving for GM, you get a geometric mean rate of return of approximately 11.15%.
By following these steps and using the formula, investors can accurately calculate the geometric mean rate of return, gaining a deeper understanding of their investment’s performance over time. In the next section, we will explore how to interpret the results of the geometric mean rate of return calculation.
Interpreting Geometric Mean Rate of Return: What the Numbers Mean
Once the geometric mean rate of return is calculated, it’s essential to understand what the numbers represent and how to use them to inform investment decisions. The geometric mean rate of return provides a more accurate representation of an investment’s performance over time, taking into account the compounding effect of returns.
The geometric mean rate of return represents the rate of return that would have been required to produce the same total return as the actual returns over the specified period. This rate of return is a more accurate representation of an investment’s performance because it accounts for the compounding effect of returns, which can significantly impact the overall performance of an investment.
For example, if the geometric mean rate of return is 10%, it means that the investment would have needed to earn a 10% return each year to produce the same total return as the actual returns over the specified period. This information can be used to evaluate the performance of an investment, compare it to other investment options, and make informed decisions about future investments.
When interpreting the geometric mean rate of return, it’s essential to consider the time period over which the returns were calculated. A longer time period will provide a more accurate representation of an investment’s performance, as it takes into account the compounding effect of returns over a longer period.
Additionally, the geometric mean rate of return can be used to evaluate the performance of a portfolio or compare the performance of different investments. By calculating the geometric mean rate of return for each investment, investors can compare the performance of different investments and make informed decisions about which investments to include in their portfolio.
In the next section, we will explore real-world applications of geometric mean rate of return, including how it is used in investment analysis and portfolio management.

Real-World Applications of Geometric Mean Rate of Return
The geometric mean rate of return has numerous real-world applications in investment analysis and portfolio management. One of the most common uses is in evaluating the performance of a portfolio or comparing the performance of different investments.
For example, let’s say an investor wants to compare the performance of two mutual funds, Fund A and Fund B, over a 5-year period. By calculating the geometric mean rate of return for each fund, the investor can determine which fund has performed better over the specified period. This information can be used to make informed decisions about which fund to invest in or to adjust the portfolio allocation.
Another common application of geometric mean rate of return is in evaluating the performance of a portfolio manager or investment advisor. By calculating the geometric mean rate of return for a portfolio, investors can assess the manager’s performance and make decisions about whether to continue investing with them.
In addition, geometric mean rate of return can be used to evaluate the performance of different asset classes, such as stocks, bonds, or real estate. This information can be used to make informed decisions about asset allocation and to optimize portfolio performance.
Geometric mean rate of return is also used in risk analysis and portfolio optimization. By calculating the geometric mean rate of return for different investments, investors can assess the risk-return tradeoff and make informed decisions about which investments to include in their portfolio.
In the next section, we will discuss common pitfalls to avoid when calculating geometric mean rate of return, including incorrect data entry or misunderstanding the formulas.
Common Pitfalls to Avoid When Calculating Geometric Mean Rate of Return
When calculating the geometric mean rate of return, it’s essential to avoid common mistakes or pitfalls that can lead to inaccurate results. One of the most common pitfalls is incorrect data entry, which can occur when inputting returns data or using the wrong formula.
Another common mistake is misunderstanding the formulas and how to apply them correctly. For example, using the arithmetic mean formula instead of the geometric mean formula can lead to inaccurate results. It’s essential to understand the difference between the two formulas and how to apply them correctly.
Additionally, failing to account for compounding can lead to inaccurate results. Geometric mean rate of return takes into account the compounding effect of returns, which can significantly impact the overall performance of an investment. Failing to account for compounding can lead to an inaccurate representation of investment performance.
Furthermore, using a small sample size or a short time period can lead to inaccurate results. Geometric mean rate of return is a long-term measure of investment performance, and using a small sample size or a short time period can lead to an inaccurate representation of investment performance.
It’s also important to avoid using geometric mean rate of return in isolation. This metric should be used in conjunction with other metrics, such as standard deviation and Sharpe ratio, to get a comprehensive view of investment performance.
By avoiding these common pitfalls, investors can ensure that they are getting an accurate representation of investment performance and making informed decisions about their investments. In the next section, we will discuss how to use Excel to calculate geometric mean rate of return, including tips on how to set up the formulas and functions to simplify the process.
Geometric Mean Rate of Return in Excel: Simplifying the Calculation Process
Calculating geometric mean rate of return can be a complex and time-consuming process, but using Excel can simplify the calculation and reduce the risk of errors. In this section, we will provide a step-by-step guide on how to use Excel to calculate geometric mean rate of return.
To calculate geometric mean rate of return in Excel, you will need to follow these steps:
Step 1: Enter the returns data into a column in Excel. This can be done by entering the returns for each period, such as monthly or annually, into a column.
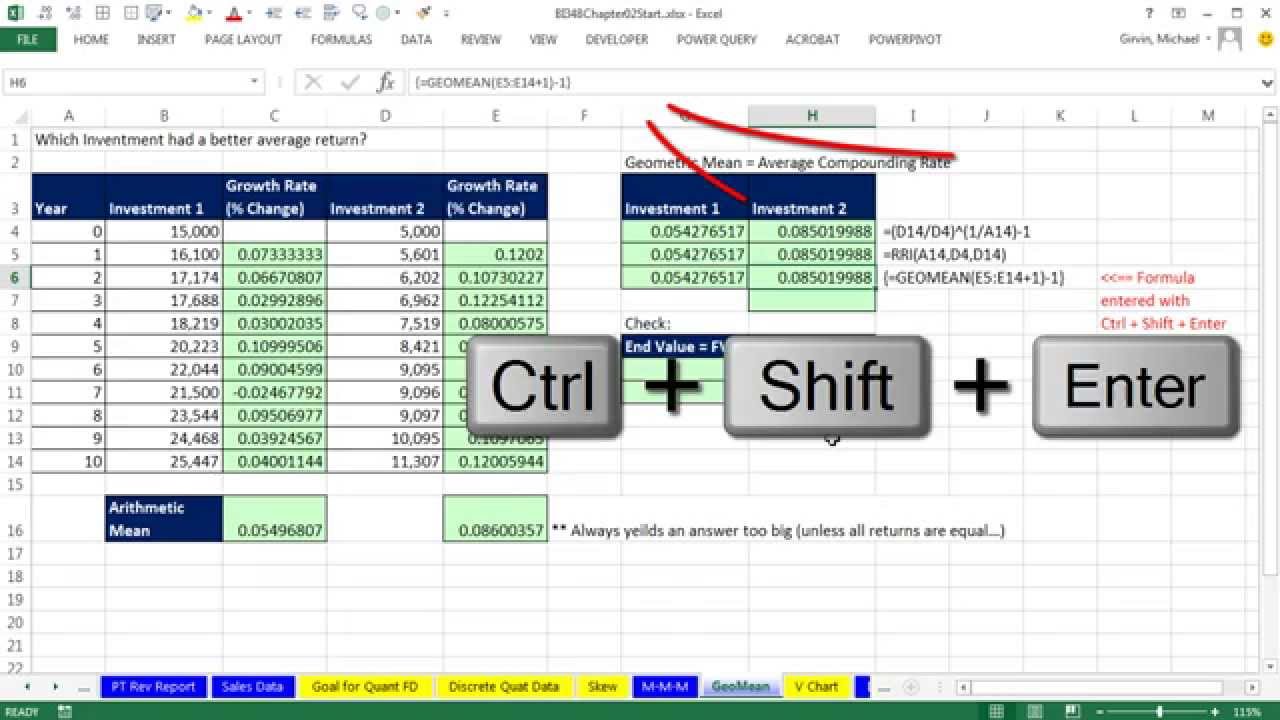
Step 2: Calculate the product of the returns using the PRODUCT function in Excel. This can be done by using the formula =PRODUCT(1+A1:A10), where A1:A10 is the range of cells containing the returns data.
Step 3: Calculate the geometric mean rate of return using the POWER function in Excel. This can be done by using the formula =POWER(B1,1/COUNT(A1:A10))-1, where B1 is the result of the PRODUCT function and A1:A10 is the range of cells containing the returns data.
By using Excel to calculate geometric mean rate of return, investors can simplify the calculation process and reduce the risk of errors. Additionally, Excel allows investors to easily update the returns data and recalculate the geometric mean rate of return, making it a valuable tool for investment analysis.
It’s also important to note that Excel has a built-in function called GEOMEAN, which can be used to calculate the geometric mean rate of return. This function can be used by entering the formula =GEOMEAN(A1:A10), where A1:A10 is the range of cells containing the returns data.
By mastering how to calculate geometric mean rate of return in Excel, investors can unlock the power of this metric and make more informed investment decisions. In the next section, we will summarize the importance of geometric mean rate of return in investment analysis and provide a final thought on how mastering this concept can improve investment decision-making.

Conclusion: Unlocking the Power of Geometric Mean Rate of Return in Investment Analysis
In conclusion, mastering the concept of geometric mean rate of return is essential for investors seeking to make informed investment decisions. By understanding how to calculate geometric mean rate of return, investors can gain a more accurate representation of investment performance over time, making it a valuable tool for evaluating portfolio performance and comparing investment options.
Throughout this article, we have provided a comprehensive guide on how to calculate geometric mean rate of return, including the necessary formulas and examples to illustrate the process. We have also discussed the importance of avoiding common pitfalls when calculating geometric mean rate of return and how to use Excel to simplify the calculation process.
By applying the concepts outlined in this article, investors can unlock the power of geometric mean rate of return and make more informed investment decisions. Whether evaluating portfolio performance or comparing investment options, geometric mean rate of return provides a valuable insight into investment performance over time.
In today’s fast-paced investment landscape, having a deep understanding of geometric mean rate of return can be a key differentiator for investors seeking to achieve long-term success. By mastering this concept, investors can gain a competitive edge and make more informed investment decisions.
In summary, geometric mean rate of return is a powerful tool for investment analysis, and understanding how to calculate and interpret it is essential for investors seeking to achieve long-term success. By applying the concepts outlined in this article, investors can unlock the power of geometric mean rate of return and make more informed investment decisions.