Why Understanding Past Performance Matters
Investors seeking to make informed decisions about their investments can greatly benefit from analyzing historical market data, including the S&P 500 total return. By examining the past performance of the market, investors can identify trends, patterns, and correlations that can inform their investment strategies. The S&P 500 total return historical data, in particular, provides a valuable lens through which to view the market’s behavior over time. This data can reveal how the market has responded to different economic conditions, such as inflation, interest rates, and recessions, allowing investors to anticipate potential risks and opportunities. Moreover, understanding past performance can help investors avoid common pitfalls, such as chasing hot investments or making emotional decisions based on short-term market fluctuations. By grounding their investment decisions in a deep understanding of historical market data, investors can increase their chances of long-term success.
A Brief History of the S&P 500 Index
The S&P 500 index, a widely followed benchmark of the US stock market, has a rich history that spans over 60 years. First introduced in 1957, the index was created by Standard & Poor’s, a leading provider of financial market data and analytics. Initially composed of 90 stocks, the index has undergone several changes over the years, expanding to its current 500 constituents in 1957. The S&P 500 index is designed to represent the market value of large-cap US stocks, with companies selected based on market size, liquidity, and industry representation. The index is widely regarded as a proxy for the overall US stock market, and its performance is closely watched by investors and financial analysts alike. Key events and milestones that have shaped the market include the 1973-1974 bear market, the 1987 stock market crash, and the dot-com bubble of the late 1990s and early 2000s. Understanding the evolution of the S&P 500 index is essential for investors seeking to analyze S&P 500 total return historical data and make informed investment decisions.
How to Access S&P 500 Total Return Historical Data
Obtaining S&P 500 total return historical data is a crucial step in analyzing the market’s past performance and identifying trends. Fortunately, there are several sources and methods for accessing this data. Online databases such as Quandl, Alpha Vantage, and Yahoo Finance provide free or low-cost access to S&P 500 total return historical data, often with downloadable CSV files or APIs for easy integration into analysis tools. Financial websites like Investopedia, Seeking Alpha, and Kiplinger also offer S&P 500 total return historical data, often with interactive charts and graphs. Academic resources, including the Wharton Research Data Services (WRDS) platform and the Federal Reserve Economic Data (FRED) database, provide comprehensive and reliable S&P 500 total return historical data for researchers and analysts. Additionally, investors can also access S&P 500 total return historical data through financial institutions, such as brokerage firms and investment banks, which often provide proprietary data and analysis tools. By leveraging these sources, investors can gain valuable insights from S&P 500 total return historical data and make informed investment decisions.
What Does the Data Reveal?
Analyzing S&P 500 total return historical data reveals a wealth of insights and trends that can inform investment decisions. One key takeaway is the impact of inflation on the market. Historical data shows that high inflation periods, such as the 1970s, have led to lower S&P 500 total returns, while low inflation periods, such as the 1990s, have coincided with higher returns. Interest rates also play a significant role, with rising rates often leading to decreased market performance. Economic cycles, including recessions and expansions, also have a profound impact on the S&P 500 total return. For instance, historical data shows that the market tends to perform poorly during recessions, but rebounds strongly during expansions. Additionally, the data highlights the importance of sector rotation, with certain sectors, such as technology and healthcare, outperforming others during specific time periods. Furthermore, S&P 500 total return historical data reveals the significance of valuation metrics, such as the price-to-earnings ratio, in predicting future market performance. By analyzing these trends and patterns, investors can gain a deeper understanding of the market and make more informed investment decisions.
https://www.youtube.com/watch?v=LPVLTaLPcIE
The Role of Dividends in Total Return
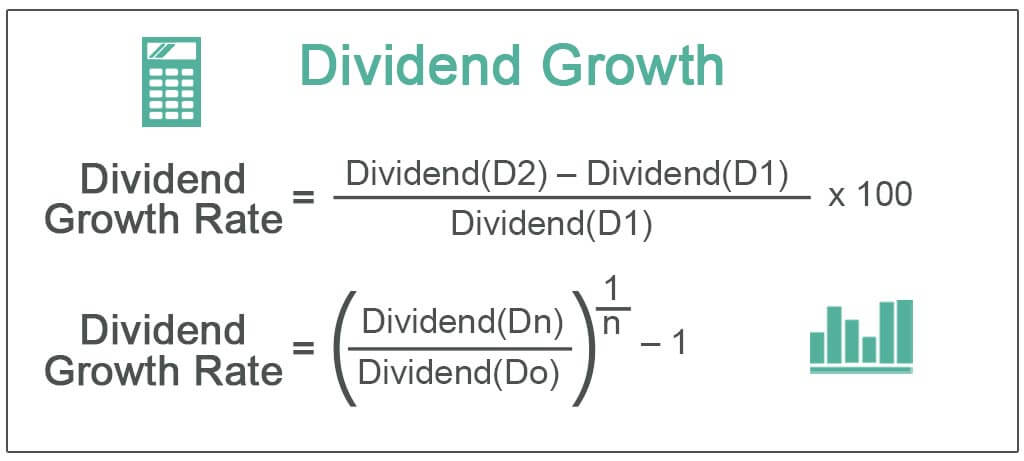
Dividends play a crucial role in the S&P 500 total return, contributing significantly to overall returns. Historical data reveals that dividends have accounted for approximately 40% of the S&P 500’s total return since 1928. This highlights the importance of dividend-paying stocks in investment portfolios. Furthermore, the dividend yield, which is the ratio of the annual dividend payment to the stock’s current price, has a profound impact on investment decisions. A high dividend yield can indicate a relatively undervalued stock, making it an attractive investment opportunity. Conversely, a low dividend yield may suggest a overvalued stock. S&P 500 total return historical data also shows that dividend-paying stocks tend to be less volatile than non-dividend payers, providing a relatively stable source of income for investors. By analyzing the role of dividends in the S&P 500 total return, investors can gain a deeper understanding of the market and make more informed investment decisions. For instance, dividend-focused investment strategies, such as the “Dogs of the Dow” approach, have been shown to outperform the broader market over the long term. By incorporating S&P 500 total return historical data into their analysis, investors can identify high-quality dividend stocks and optimize their investment portfolios.
Using Historical Data to Inform Investment Strategies
By analyzing S&P 500 total return historical data, investors can develop effective investment strategies that take into account the market’s past performance. One approach is value investing, which involves identifying undervalued stocks with strong fundamentals. Historical data reveals that value stocks have outperformed the broader market over the long term, making them an attractive investment opportunity. Growth investing is another strategy that can be informed by S&P 500 total return historical data. By identifying sectors and industries that have historically outperformed the market, investors can position themselves for future growth. Dividend investing is another approach that can be informed by historical data. By analyzing the dividend yield and payout ratio of individual stocks, investors can identify high-quality dividend payers that can provide a relatively stable source of income. Furthermore, S&P 500 total return historical data can be used to identify trends and patterns in the market, such as the impact of economic cycles and interest rates on stock performance. By incorporating these insights into their investment decisions, investors can develop a more informed and effective investment strategy. Additionally, historical data can be used to backtest investment strategies, allowing investors to evaluate their performance and make adjustments as needed. By leveraging S&P 500 total return historical data, investors can gain a competitive edge in the market and make more informed investment decisions.
Limitations and Caveats of Historical Data Analysis
While S&P 500 total return historical data can provide valuable insights into the market’s past performance, it is essential to acknowledge the limitations and potential pitfalls of relying solely on historical data. One of the primary concerns is overfitting, where a model is overly complex and fits the noise in the historical data rather than the underlying trends. This can lead to poor out-of-sample performance and inaccurate predictions. Another limitation is survivorship bias, where the historical data only includes companies that have survived and thrived, rather than those that have failed or gone bankrupt. This can create an overly optimistic view of the market’s performance and lead to poor investment decisions. Furthermore, historical data analysis should not be used in isolation, but rather in conjunction with other forms of research and due diligence. This includes fundamental analysis, technical analysis, and macroeconomic analysis, among others. By considering multiple factors and approaches, investors can gain a more comprehensive understanding of the market and make more informed investment decisions. Additionally, it is essential to recognize that past performance is not necessarily indicative of future results, and that the market is inherently unpredictable. By acknowledging these limitations and caveats, investors can use S&P 500 total return historical data as a valuable tool, rather than a sole determinant, of their investment decisions.
Putting it All Together: A Data-Driven Approach to Investing
By combining S&P 500 total return historical data with other forms of research and due diligence, investors can develop a comprehensive understanding of the market and make informed investment decisions. This data-driven approach allows investors to identify trends, patterns, and insights that can inform their investment strategies. By analyzing the S&P 500 total return historical data, investors can gain a deeper understanding of the market’s past performance and identify opportunities for growth. Additionally, by considering multiple factors, including fundamental analysis, technical analysis, and macroeconomic analysis, investors can develop a more nuanced understanding of the market and make more informed investment decisions. Furthermore, by incorporating S&P 500 total return historical data into their investment process, investors can reduce the risk of emotional decision-making and instead, make data-driven decisions that are grounded in evidence. Ultimately, a data-driven approach to investing can help investors achieve their long-term financial goals and navigate the complexities of the market with confidence. By leveraging S&P 500 total return historical data, investors can unlock the power of historical market data and make more informed investment decisions.


.jpg?mode=max)


