What is Standard Deviation in Finance?
In finance, standard deviation is a statistical measure that quantifies the volatility or dispersion of an investment’s returns. It provides a numerical value that indicates how much an investment’s returns deviate from its mean return. A higher standard deviation indicates higher volatility, while a lower standard deviation suggests lower volatility. In investment analysis, standard deviation is a critical component in evaluating the risk profile of an investment. By understanding standard deviation, investors can better assess the potential risks and rewards associated with a particular investment. The standard deviation of returns formula is a powerful tool in this regard, allowing investors to calculate and compare the volatility of different investments.

Click Image to Find Quantum Products
How to Calculate Standard Deviation of Returns
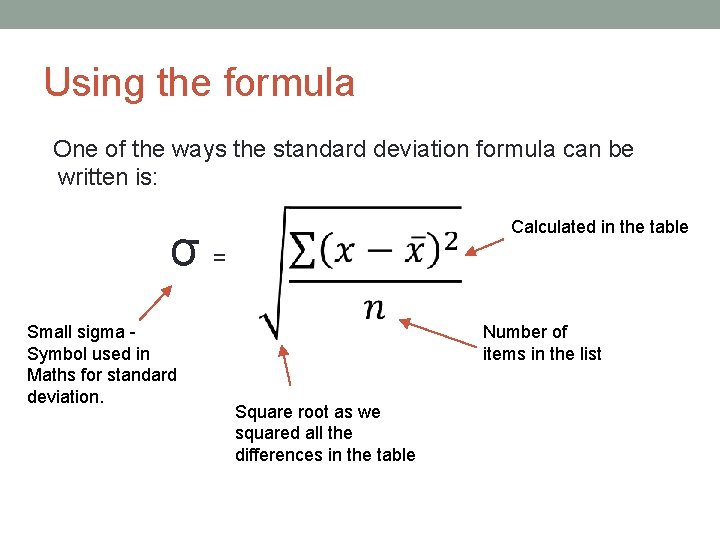
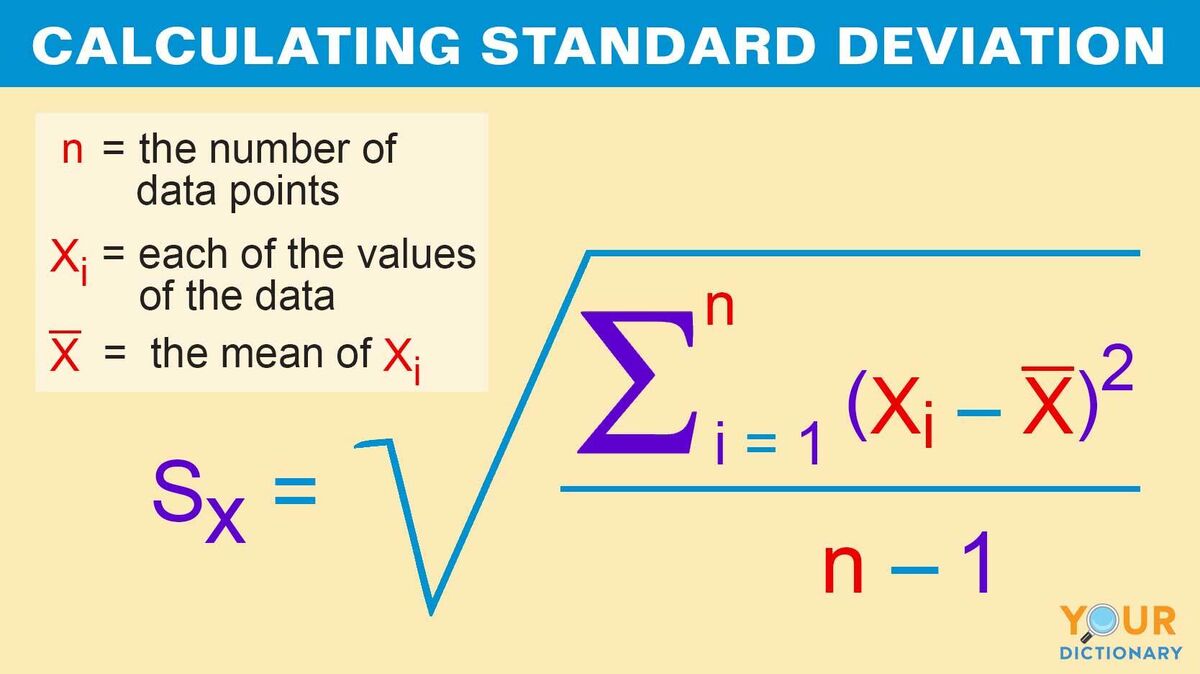
To calculate the standard deviation of returns, investors can use the following formula: σ = √[(Σ(xi – μ)^2) / (n – 1)], where σ is the standard deviation, xi is each individual return, μ is the mean return, and n is the sample size. This formula may seem complex, but breaking it down into its components can make it more manageable. The first step is to calculate the mean return (μ) by summing up all the individual returns and dividing by the sample size. Next, calculate the squared differences between each individual return
Understanding the Standard Deviation Formula
The standard deviation of returns formula, σ = √[(Σ(xi – μ)^2) / (n – 1)], may seem complex, but each component plays a crucial role in calculating the volatility of an investment. The mean return (μ) is the average return of the investment over a given period, providing a baseline for comparison. The squared differences (xi – μ)^2 represent the deviations of each individual return from the mean return, highlighting the dispersion of returns. The sample size (n) is the number of observations or data points used in
Interpreting Standard Deviation Results
Once the standard deviation of returns is calculated using the standard deviation of returns formula, it’s essential to interpret the results correctly. A high standard deviation indicates that an investment’s returns are more volatile, meaning they deviate significantly from the mean return. This suggests a higher level of risk, as the investment’s value can fluctuate rapidly. On the other hand, a low standard deviation indicates that an investment’s returns are more stable, with less volatility and a lower risk profile.
In general, a standard deviation of 10% or less is considered low, while a standard deviation above 20% is considered high. However, the interpretation of standard deviation results also depends on the investment’s context and the investor’s goals. For example, a high-risk investor may be comfortable with a higher standard deviation, while a conservative investor may prefer a lower standard deviation.
It’s also important to consider the standard deviation in relation to the investment’s mean return. A high standard deviation with a high mean return may be more attractive than a low standard deviation with a low mean return. Ultimately, the standard deviation of returns provides a valuable insight into an investment’s risk profile, allowing investors to make informed decisions about their portfolio.
:max_bytes(150000):strip_icc()/Standard-Deviation-ADD-SOURCE-e838b9dcfb89406e836ccad58278f4cd.jpg)
Real-World Applications of Standard Deviation
Standard deviation is a widely used metric in investment analysis, and its applications are diverse and far-reaching. In portfolio optimization, standard deviation is used to construct an optimal portfolio that balances risk and return. By calculating the standard deviation of individual assets and the portfolio as a whole, investors can identify the most efficient portfolio that meets their risk tolerance.
In risk management, standard deviation is used to quantify and manage risk exposure. For example, a fund manager may use standard deviation to set risk limits for individual positions or to monitor the overall risk profile of the portfolio. This helps to identify potential risks and take corrective action to mitigate them.
In performance evaluation, standard deviation is used to assess the volatility of an investment’s returns over time. This helps investors to evaluate the performance of their investments and make informed decisions about whether to buy, sell, or hold. For instance, a mutual fund with a high standard deviation may be considered riskier than one with a low standard deviation, even if they have similar returns.
Standard deviation is also used in asset allocation, where it helps investors to determine the optimal mix of assets in their portfolio. By calculating the standard deviation of different asset classes, investors can identify the most efficient allocation that meets their risk and return objectives.
In addition, standard deviation is used in option pricing models, such as the Black-Scholes model, to estimate the volatility of underlying assets. This helps investors to value options and make informed decisions about their investments.
In conclusion, standard deviation is a versatile metric that has numerous applications in investment analysis. By understanding how to calculate and interpret standard deviation, investors can make more informed decisions about their investments and achieve their financial goals.
Common Mistakes to Avoid When Calculating Standard Deviation
When calculating standard deviation, it’s essential to avoid common mistakes that can lead to inaccurate results. One of the most common mistakes is incorrect data input. This can occur when the data is incomplete, outdated, or incorrect, leading to a skewed standard deviation calculation. To avoid this, ensure that the data is accurate, complete, and up-to-date.
Another common mistake is misunderstanding the standard deviation of returns formula. This can occur when the formula is not applied correctly, or when the components of the formula are not fully understood. To avoid this, take the time to thoroughly understand the formula and its components, including the mean return, squared differences, and sample size.
Additionally, failing to consider the sample size can lead to inaccurate results. A small sample size can result in a biased standard deviation calculation, while a large sample size can provide a more accurate representation of the investment’s volatility. To avoid this, ensure that the sample size is sufficient and representative of the investment’s returns.
Furthermore, ignoring the time frame of the data can also lead to inaccurate results. The standard deviation of returns can vary significantly depending on the time frame used, with shorter time frames typically resulting in higher standard deviations. To avoid this, ensure that the time frame used is appropriate for the investment and the analysis being conducted.
Finally, failing to consider the distribution of returns can also lead to inaccurate results. The standard deviation of returns assumes a normal distribution of returns, but in reality, returns may not always follow a normal distribution. To avoid this, consider using alternative risk metrics, such as value-at-risk (VaR), which can provide a more accurate representation of an investment’s risk profile.
By avoiding these common mistakes, investors can ensure that their standard deviation calculations are accurate and reliable, providing a better understanding of an investment’s risk profile and enabling more informed investment decisions.

Standard Deviation vs. Other Risk Metrics
In investment analysis, standard deviation is just one of several risk metrics used to measure an investment’s volatility. Other popular risk metrics include variance, beta, and value-at-risk (VaR). While each of these metrics provides valuable insights into an investment’s risk profile, they have distinct strengths and weaknesses.
Variance, for example, is similar to standard deviation in that it measures the dispersion of an investment’s returns. However, variance is more sensitive to extreme values, making it a better metric for investments with fat-tailed distributions. On the other hand, standard deviation is more intuitive and easier to interpret, making it a popular choice for investors.
Beta, another popular risk metric, measures an investment’s systematic risk, or its sensitivity to market movements. While beta is useful for evaluating an investment’s risk relative to the broader market, it does not provide a complete picture of an investment’s volatility. Standard deviation, on the other hand, provides a more comprehensive measure of an investment’s risk profile.
Value-at-risk (VaR), a more advanced risk metric, estimates the potential loss of an investment over a specific time horizon with a given probability. While VaR provides a more nuanced view of an investment’s risk profile, it requires more complex calculations and is often more difficult to interpret than standard deviation.
In conclusion, while each of these risk metrics has its strengths and weaknesses, standard deviation remains a popular and widely used metric in investment analysis. Its ease of calculation and interpretation, combined with its ability to provide a comprehensive measure of an investment’s volatility, make it an essential tool for investors seeking to understand and manage risk.
By understanding the strengths and weaknesses of each risk metric, investors can choose the most appropriate metric for their specific needs and make more informed investment decisions. Whether using standard deviation, variance, beta, or VaR, a thorough understanding of these risk metrics is essential for navigating the complex world of investment analysis.
Conclusion: The Importance of Standard Deviation in Investment Analysis
In conclusion, standard deviation is a crucial concept in investment analysis, providing a quantitative measure of an investment’s volatility and risk profile. By understanding how to calculate and interpret standard deviation, investors can make more informed decisions and manage risk more effectively.
The standard deviation of returns formula is a powerful tool in the investor’s toolkit, allowing for the quantification of an investment’s volatility and the comparison of different investments. Whether used in portfolio optimization, risk management, or performance evaluation, standard deviation is an essential metric for investors seeking to navigate the complex world of investment analysis.
By recognizing the importance of standard deviation, investors can avoid common pitfalls and make more informed decisions. By understanding the strengths and weaknesses of standard deviation, as well as its relationship to other risk metrics, investors can develop a more nuanced understanding of investment risk and make more effective decisions.
In today’s fast-paced and increasingly complex investment landscape, the ability to accurately measure and manage risk is more important than ever. By mastering the standard deviation of returns formula and understanding its role in investment analysis, investors can gain a competitive edge and achieve their investment goals with confidence.
