What is Beta in Finance?
In finance, beta is a crucial concept for understanding and estimating risk. Specifically, it helps to understand how to calculate beta of equity. Beta measures a stock’s volatility or systematic risk relative to the overall market. It essentially indicates how much a stock’s price tends to fluctuate compared to the market as a whole. A beta greater than 1 suggests that the stock is more volatile than the market. This means that the stock’s price will likely move up or down more dramatically than the market. A beta equal to 1 indicates that the stock’s price will move in line with the market. Conversely, a beta less than 1 implies that the stock is less volatile than the market. These differences help understand how to calculate beta of equity in different scenarios.
To illustrate, consider a tech stock known for its rapid growth and innovation. Such a stock might have a beta of 1.5. This suggests it’s 50% more volatile than the market. If the market goes up by 10%, this tech stock might go up by 15%. On the other hand, a utility stock, which provides essential services and tends to be more stable, might have a beta of 0.7. If the market goes up by 10%, this utility stock might only go up by 7%. Therefore, different values shows us how to calculate beta of equity.
Understanding beta is essential for investors looking to manage their portfolio’s risk. It allows them to gauge how sensitive their investments are to broader market movements. Knowing how to calculate beta of equity allows for constructing portfolios aligned with your specific risk tolerance. While beta is a useful tool, it’s important to remember that it’s based on historical data. Therefore, it is not necessarily predictive of future performance. Beta is a key component to understand the relationship of individual stocks to the broader market, playing a vital role in assessing potential risk and returns.
Delving into the Equity Beta Formula
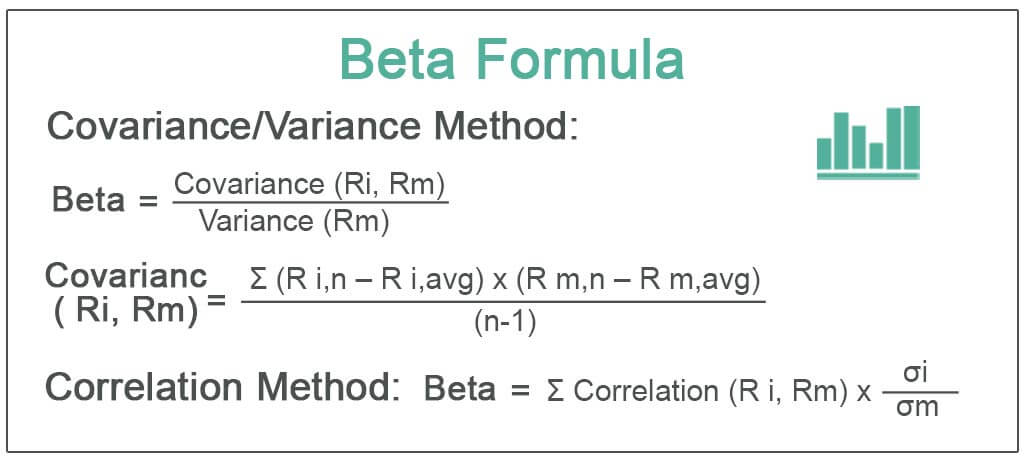
The core formula to understand how to calculate beta of equity involves covariance and variance. It’s essential to grasp each component for accurate computation. The formula is expressed as Beta = Covariance(Asset Returns, Market Returns) / Variance(Market Returns). This formula shows how to calculate beta of equity effectively.
The numerator, Covariance(Asset Returns, Market Returns), quantifies how the returns of an asset move in relation to the returns of the market. A positive covariance suggests that the asset’s returns tend to increase when the market’s returns increase, and vice versa. The denominator, Variance(Market Returns), measures the dispersion or volatility of the market’s returns. It indicates how much the market’s returns fluctuate around their average. Breaking down the formula helps to understand how to calculate beta of equity with precision.
This formula effectively quantifies the relationship between a stock’s price movements and the overall market’s price movements. It is vital to use historical data to calculate beta of equity. Historical data provides the necessary information on past returns of the stock and the market, which are essential inputs for the covariance and variance calculations. The more historical data available, the more reliable the beta estimate will be. When learning how to calculate beta of equity, remember that the quality and length of historical data significantly impact the accuracy of the result. Utilizing the historical data, one can learn how to calculate beta of equity for informed investment decisions.
Gathering the Necessary Data for Beta Calculation
To accurately determine how to calculate beta of equity, the initial step involves gathering the necessary historical data. This data encompasses the price movements of both the specific stock in question and a relevant market index, such as the S&P 500. The selection of the market index is crucial as it serves as the benchmark against which the stock’s volatility is measured. Data can be sourced from reputable financial websites like Yahoo Finance, Google Finance, or Bloomberg, as well as from professional data providers such as Refinitiv or FactSet. These sources provide historical stock prices and market index values, which are essential for calculating returns.
Consistency in the data collection process is paramount for a reliable beta calculation. It is important to use the same time period and frequency for both the stock and the market index. For instance, one might choose to use daily returns over a five-year period, or monthly returns over a ten-year period. The choice depends on the desired level of granularity and the availability of data. Regardless of the chosen frequency, it must be applied uniformly to both the stock and the market index to ensure comparability. This consistency minimizes bias and enhances the accuracy of the beta calculation, which directly impacts the assessment of how to calculate beta of equity effectively.
Before performing calculations, the raw data often requires cleaning and preparation. This may involve addressing missing values, adjusting for stock splits or dividends, and converting prices into returns. Returns are typically calculated as the percentage change in price over a given period. For example, the daily return is calculated as (Ending Price – Beginning Price) / Beginning Price. These calculated returns then form the basis for determining covariance and variance, which are key components in the beta formula. Careful data preparation is essential to avoid errors and to ensure that the final beta value accurately reflects the stock’s relationship with the market. Understanding how to calculate beta of equity hinges on precise data handling and preprocessing.
Performing Beta Calculation in Excel: A Step-by-Step Guide
This section offers a detailed guide on how to calculate beta of equity using Microsoft Excel. This is a practical approach for investors and analysts seeking to understand a stock’s risk profile relative to the market. The process involves gathering historical stock and market data, calculating returns, and then employing Excel functions to determine beta. Screenshots can further enhance understanding, guiding the user through each step.
First, acquire the historical price data for the stock and a relevant market index, such as the S&P 500, for the same period. Financial websites or data providers are excellent sources for this information. Ensure the data’s frequency (daily, weekly, or monthly) is consistent for both the stock and the index. Next, calculate the returns for each period. This is done by subtracting the previous period’s price from the current period’s price and then dividing by the previous period’s price. With the returns calculated, the next step is to use Excel’s built-in functions to compute the covariance and variance. The COVAR function calculates the covariance between the stock’s returns and the market’s returns. The VAR.S function calculates the variance of the market’s returns. These functions are essential for accurately determining how to calculate beta of equity.
Finally, divide the covariance by the variance to arrive at the beta value. This is the core calculation: Beta = Covariance(Stock Returns, Market Returns) / Variance(Market Returns). The resulting beta value represents the stock’s volatility relative to the market. A beta greater than 1 suggests the stock is more volatile than the market, while a beta less than 1 indicates lower volatility. Understanding how to calculate beta of equity is vital for making informed investment decisions. This step-by-step guide empowers individuals to perform this calculation effectively using widely available tools like Microsoft Excel. Investors can assess risk and make strategic choices aligning with their financial goals by mastering how to calculate beta of equity using Excel.
Interpreting the Calculated Beta Value
The calculated beta value offers insights into an equity’s risk profile relative to the market. Understanding how to calculate beta of equity and interpreting it correctly is crucial for informed investment decisions. A beta of 1.0 indicates that the equity’s price will theoretically move in tandem with the market. If the market rises by 10%, the stock is expected to rise by 10%, and vice-versa. This serves as a benchmark for comparison. A beta greater than 1.0 suggests that the equity is more volatile than the market. For example, a beta of 1.2 implies that for every 10% move in the market, the stock is expected to move by 12% in the same direction. These are typically growth stocks or those in volatile sectors.
Conversely, a beta less than 1.0 suggests that the equity is less volatile than the market. A beta of 0.8 indicates that for every 10% move in the market, the stock is expected to move by only 8%. Such stocks are often found in stable, defensive sectors like utilities or consumer staples. Investors often use beta to construct portfolios that align with their risk tolerance. Those seeking higher returns and willing to accept greater risk might favor high-beta stocks. Investors prioritizing capital preservation might prefer low-beta stocks. Understanding how to calculate beta of equity allows investors to effectively manage risk.
Beta plays a crucial role in portfolio management. Portfolio managers use beta to estimate the overall risk of a portfolio and make adjustments to achieve desired risk levels. For example, a portfolio with an overall high beta can be hedged by adding low-beta assets to reduce its sensitivity to market movements. It’s important to acknowledge the limitations of beta. It is a historical measure and may not accurately predict future volatility. Beta also does not account for company-specific risks or other factors that can impact stock prices. Despite these limitations, beta remains a valuable tool for assessing relative risk and making informed investment decisions. Learning how to calculate beta of equity provides a foundation for more advanced risk analysis techniques. While valuable, it should not be the sole factor considered when evaluating an investment.
Beta Calculation with Regression Analysis
An alternative method for understanding how to calculate beta of equity involves regression analysis. This approach uses statistical software, such as R or Python, or even Excel’s built-in regression tool, to determine the beta coefficient. Regression analysis examines the relationship between a stock’s returns (dependent variable) and the market’s returns (independent variable). By plotting these returns and fitting a regression line, one can derive the beta value from the slope of the line. This slope represents the systematic risk of the equity in question.
To perform regression analysis, first gather historical returns data for both the stock and the chosen market index (e.g., S&P 500). Next, input this data into the statistical software or Excel. Using the regression function, specify the stock’s returns as the dependent variable (Y) and the market’s returns as the independent variable (X). The output of the regression analysis will include a coefficient for the independent variable (market returns). This coefficient directly represents the equity’s beta. This process offers insights into how to calculate beta of equity with statistical precision.
Compared to the covariance/variance formula, regression analysis offers certain advantages and disadvantages. A key advantage is the wealth of additional statistical information it provides, such as the R-squared value, which indicates how well the market’s returns explain the stock’s returns. Furthermore, regression analysis allows for the inclusion of additional factors that may influence a stock’s returns. However, regression analysis can be more complex and require a greater understanding of statistical principles. Also, the accuracy of the beta estimate still depends on the quality and relevance of the historical data used. Understanding how to calculate beta of equity through regression provides a robust alternative to traditional methods, offering deeper analytical insights.
The Limitations of Using Beta as a Risk Metric
While beta provides valuable insights into a stock’s volatility relative to the market, relying solely on it as a risk measure presents several limitations. Understanding how to calculate beta of equity is crucial, but it’s equally important to recognize its shortcomings. Beta’s calculation uses historical data, which may not accurately predict future performance. Market conditions change constantly. Past volatility doesn’t guarantee future volatility. A stock’s beta can fluctuate significantly over time, rendering previous calculations less relevant. Therefore, investors should treat beta as one factor among many in their investment decisions.
Moreover, beta primarily focuses on systematic risk—market-wide fluctuations. It fails to capture unsystematic risk, also known as company-specific risk. This includes risks unique to a particular company, such as poor management, product recalls, or lawsuits. Liquidity risk, the risk of not being able to easily buy or sell a stock, is also ignored by beta. A stock might have a low beta, suggesting low market risk, but still be illiquid, making it difficult to exit a position quickly if needed. This highlights the importance of diversifying investments beyond simply considering how to calculate beta of equity.
The choice of market index significantly influences the calculated beta. Using different indices, such as the S&P 500, Dow Jones Industrial Average, or a broader global index, can lead to different beta values for the same stock. This underscores the importance of carefully considering the chosen index and understanding its implications for the resulting beta value. In conclusion, while understanding how to calculate beta of equity is an essential part of investment analysis, investors should not overemphasize its predictive power. It is a useful tool, but not a definitive measure of risk. A comprehensive risk assessment requires considering additional factors beyond just beta to make informed investment decisions. Remember, beta is just one piece of a larger puzzle.>
Practical Applications: Applying Beta in Investment Decisions
Beta serves as a valuable tool in various investment scenarios, allowing investors to tailor their portfolios to specific risk profiles. Understanding how to calculate beta of equity is fundamental to informed decision-making. Investors can leverage beta to construct portfolios aligned with their individual risk tolerance, seeking higher-beta stocks for aggressive growth or opting for lower-beta stocks to enhance portfolio stability. By diversifying across assets with varying betas, investors can achieve a desired level of risk exposure.
Portfolio managers actively use beta to manage the overall risk of their portfolios. A portfolio’s beta reflects its sensitivity to market movements; a higher portfolio beta indicates greater volatility compared to the market, while a lower beta suggests less volatility. Portfolio managers can adjust the portfolio’s beta by strategically allocating assets, increasing or decreasing exposure to high-beta or low-beta stocks. This active management allows them to align the portfolio’s risk profile with the investment objectives and risk tolerance of their clients. Understanding how to calculate beta of equity enables portfolio managers to make well-informed asset allocation decisions.
Several investment strategies incorporate beta as a key factor. For example, investors seeking aggressive growth may focus on high-beta stocks, aiming to capitalize on market upswings. These stocks tend to amplify market gains but also experience greater losses during market downturns. Conversely, investors prioritizing stability may favor low-beta stocks, seeking to minimize volatility and preserve capital. These stocks tend to exhibit less pronounced price swings compared to the market. Factor investing also uses beta as a component, where portfolios are constructed based on factors like size, value, and momentum, often considering beta as a risk adjustment. Knowing how to calculate beta of equity allows investors to implement strategies based on a stock’s risk profile, it is a critical process when evaluating stocks to invest in. By understanding and applying beta effectively, investors and portfolio managers can make more informed decisions and optimize their investment outcomes.


