Decoding Market Fear: Understanding the Volatility Index
The VIX, or Volatility Index, serves as a real-time market sentiment indicator. Many refer to it as the “fear gauge.” It reflects investor expectations regarding market volatility over the coming 30 days. Understanding the VIX is important for investors and traders alike. It provides insights into the overall risk environment. This understanding can inform decisions about portfolio allocation and trading strategies. The VIX offers a forward-looking perspective on market stability. It helps anticipate potential market swings. How is the VIX calculated? It’s not a direct measure of stock prices, but rather, it’s derived from options prices. These options relate to the S&P 500 index. A higher VIX typically indicates greater uncertainty and fear. A lower VIX suggests complacency and stability.
The VIX is a crucial tool for assessing market risk. It helps quantify the level of anxiety present in the market. Investors often use the VIX to gauge when to buy or sell assets. High VIX levels might signal a potential buying opportunity. This is because assets may be undervalued due to widespread fear. Conversely, low VIX levels could indicate an overvalued market. This suggests a possible correction is on the horizon. How is the VIX calculated? This is a complex process, but understanding its implications is straightforward. Recognizing the VIX as a sentiment indicator allows investors to adjust their strategies accordingly. It offers a valuable layer of insight into market dynamics.
The VIX should not be the only factor considered when making investment decisions. It is one piece of the larger economic puzzle. Many other indicators should also be consulted. However, understanding how is the VIX calculated and interpreted is a valuable skill. It empowers investors to navigate market volatility with greater confidence. It provides a quick snapshot of the overall market mood. This allows for a more nuanced approach to risk management. The VIX is a powerful tool for those seeking to understand market sentiment. It serves as a valuable gauge of potential market turbulence.
How to Interpret VIX Values: A Practical Guide
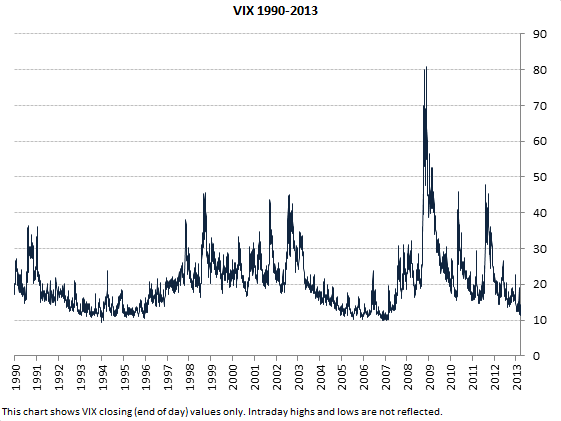
Understanding VIX values is crucial for gauging market sentiment. Generally, a VIX reading below 20 suggests a period of relative market complacency. This indicates that investors are not expecting significant price swings in the near term. Low VIX values can sometimes precede unexpected market corrections, as low volatility can breed overconfidence. Understanding how is the vix calculated can give you an edge in predicting these corrections.
Conversely, a VIX reading above 30 typically signals heightened market fear and uncertainty. This suggests that investors anticipate substantial price volatility in the S&P 500 index. Elevated VIX levels often coincide with market downturns or periods of economic instability. It’s important to note that these are general guidelines, and the specific interpretation of VIX values can depend on the broader economic context. For example, during periods of economic recovery, a VIX of 25 might still indicate significant uncertainty, while in a stable market, it might represent a more moderate level of concern. Knowing how is the vix calculated helps to better asses the risk of the investments.
However, the VIX has limitations and shouldn’t be the sole determinant of investment decisions. It is a snapshot of current market expectations, not a crystal ball. The VIX reacts to news and events, sometimes overreacting in the short term. Relying solely on the VIX can lead to missed opportunities or premature market exits. It is essential to consider other technical indicators, fundamental analysis, and your own risk tolerance when making investment choices. Also, it is helpful to explore how is the vix calculated to understand the basics of VIX. The VIX is a valuable tool, but it functions best when used in conjunction with other indicators and a well-defined investment strategy.
Unveiling the Methodology Behind VIX Calculation
The VIX, a barometer of market sentiment, isn’t pulled from thin air. Understanding how is the VIX calculated involves a journey into the world of options, specifically those tied to the S&P 500 index. The VIX calculation is derived from the prices of these options, offering a window into what investors collectively anticipate for market volatility in the near term. The beauty of the VIX lies in its forward-looking nature; it doesn’t dwell on past volatility but forecasts the expected movement of the S&P 500 over the subsequent 30-day period.
To grasp how is the VIX calculated, it’s important to understand the roles of call and put options. Call options give the buyer the right, but not the obligation, to buy the underlying asset (in this case, the S&P 500 index) at a specific price (the strike price) on or before a specific date (the expiration date). Put options, conversely, give the buyer the right to sell the underlying asset at a specific price on or before a specific date. The prices of these options reflect the market’s expectation of future price swings. High option prices often signal anticipated volatility, as investors are willing to pay more for the insurance these options provide. The relationship between these two option types is fundamental to how is the VIX calculated.
It’s crucial to emphasize that we’re building a conceptual understanding before diving into the mathematical intricacies. Think of the VIX as a sophisticated averaging mechanism that weighs the prices of numerous S&P 500 options. These options span a range of strike prices, reflecting the market’s assessment of the probabilities of different price levels for the S&P 500. The essence of how is the VIX calculated lies in extracting this probability distribution from the options prices and distilling it into a single, readily interpretable number. Subsequent sections will delve deeper into the specific components of the formula, illustrating how each element contributes to the final VIX value. This will make clear how is the VIX calculated and its importance.
Options Pricing: The Building Blocks of VIX
Understanding options pricing is crucial to grasping how is the vix calculated. Options are contracts that give the buyer the right, but not the obligation, to buy (call option) or sell (put option) an underlying asset (in this case, S&P 500 index) at a specific price (strike price) on or before a specific date (expiration date). The price of an option reflects the market’s assessment of the probability of the underlying asset’s price moving above (for calls) or below (for puts) the strike price before expiration. Options with strike prices closer to the current market price of the S&P 500 tend to be more actively traded and have a greater impact on the VIX calculation.
Several factors influence option prices, including the current market price of the underlying asset, the strike price, time until expiration, and implied volatility. Implied volatility represents the market’s expectation of future price fluctuations. Higher implied volatility suggests a greater expectation of price swings, leading to higher option prices. How is the vix calculated using this implied volatility? It forms the core of the VIX calculation, as it directly reflects market sentiment and expected volatility. Options with shorter times to expiration are generally more sensitive to changes in implied volatility, offering a more immediate read on current market sentiment. This sensitivity is factored into the VIX calculation, weighting shorter-term options more heavily.
The relationship between strike prices and time to expiration is essential in determining the weight each option price carries in the VIX calculation. Options with strike prices further from the current market price contribute less to the overall calculation than those closer to the current price. Similarly, options expiring sooner have a larger impact than those with a longer time to expiration. This weighting mechanism is crucial for accurately capturing the market’s short-term volatility expectations and understanding how is the vix calculated. The combination of these factors, weighed according to their proximity to the current market price and time to expiration, provides a comprehensive measure of market-implied volatility, forming the foundation of the VIX calculation.
The Formula Unpacked: A Closer Look at VIX Math
Understanding how is the VIX calculated requires examining its core formula. The VIX isn’t a single number; it’s a weighted average reflecting the market’s expectation of S&P 500 volatility over the next 30 days. This weighted average incorporates prices from a range of S&P 500 index options, specifically call and put options with various strike prices and time to expiration. The formula itself is complex, but its essence lies in considering the prices of these options across a spectrum of potential future index values.
A simplified representation emphasizes the key components. The formula weights options prices based on their proximity to the current S&P 500 index level and their time to expiration. Options closer to the current index price and with shorter times until expiration receive greater weight. This reflects the market’s greater sensitivity to near-term price changes. Variables include the prices of the options themselves, the time until expiration (expressed in years), the current risk-free interest rate, and the strike prices of the options. How is the VIX calculated precisely? It involves sophisticated statistical techniques that account for the probability-weighted average of potential future S&P 500 index values, derived from these option prices. The weighting process adjusts for the differing probabilities of different outcomes occurring.
While the full mathematical expression is intricate, the core concept remains straightforward. The VIX calculation aggregates information from numerous S&P 500 index options, effectively creating a composite measure of anticipated volatility. Each option’s price reflects the market’s view of the likelihood of the index reaching that specific strike price by the option’s expiration date. By combining these individual signals via a weighted average, the VIX provides a comprehensive, albeit complexly derived, indicator of market-implied volatility. Understanding how is the VIX calculated helps investors interpret this key indicator of market sentiment. The process, while mathematically intensive, produces a single number that summarizes a vast amount of market information related to future price movements.
Calculating VIX in Practice: Examples and Considerations
Understanding how is the VIX calculated requires examining its components. Let’s illustrate with a simplified example. Imagine a scenario where several S&P 500 index options are trading. We’ll focus on a few key options with different strike prices and time to expiration. Assume the following hypothetical data: Option A (near-the-money call) has a price of $5, Option B (out-of-the-money put) is priced at $2, while Option C (in-the-money put) trades at $8. Each option has a different time to expiration and strike price. The VIX formula, which is a complex weighted average, considers all such options. It weighs these prices based on their proximity to the current market price of the S&P 500, their strike prices, and the time until they expire. The closer an option’s strike price is to the current market index value, the more heavily it influences the VIX calculation. Options with shorter times to expiration have a greater impact. Calculating the VIX manually, using a simplified approach, would involve inputting these various option prices and their respective weights into the formula. This process provides a rough approximation; the actual VIX calculation performed by the Chicago Board Options Exchange (CBOE) is considerably more intricate.
The challenge in manually calculating the VIX lies in obtaining comprehensive and real-time data on all relevant S&P 500 index options. The CBOE utilizes sophisticated software and algorithms to process vast amounts of data continuously. How is the VIX calculated in real-world conditions? The actual calculation involves numerous options contracts with various strike prices and expirations, far beyond what a simplified example can capture. Factors like interest rates and the current index value also impact the calculation significantly. The weighting scheme is designed to accurately reflect the market’s overall expectation of future volatility. Real-world complexities such as market microstructure effects and potential arbitrage opportunities further add to the challenge of accurate manual computation. The CBOE’s methodology strives to mitigate these complications, ensuring the VIX remains a robust indicator. Therefore, while understanding the core principles and elements of how is the VIX calculated is beneficial, precise manual calculation is impractical.
In summary, while a simplified illustration helps comprehend the VIX calculation’s fundamental concepts, accurately calculating the VIX requires a complex process that incorporates numerous options contracts and advanced mathematical techniques. How is the VIX calculated in reality? By using proprietary algorithms and real-time market data, the CBOE provides a reliable and efficient estimate of market volatility, providing invaluable insights into investor sentiment and future market behavior. While a basic understanding of the formula’s elements is useful, the intricate nature of the actual calculation reinforces the reliance on official VIX data from the CBOE. The simplified example serves only to show the core principles involved in determining how is the VIX calculated.
Factors Influencing VIX Fluctuations
Numerous factors can influence VIX fluctuations, creating a dynamic and responsive market environment. Economic news plays a significant role. Reports on inflation, unemployment, and GDP growth can trigger shifts in investor sentiment. Positive economic data may lead to lower VIX values, suggesting reduced uncertainty. Conversely, negative news can increase the VIX, reflecting heightened anxiety about market performance. Understanding how is the vix calculated, therefore, needs understanding of multiple market factors.
Geopolitical events also exert considerable influence. International conflicts, political instability, and trade disputes can all contribute to VIX spikes. Uncertainty surrounding these events often leads investors to seek protection. This increased demand for options drives up their prices. This, in turn, elevates the VIX. Earnings announcements from major companies are another key factor. Unexpectedly poor results can rattle investors and trigger a rise in volatility. Conversely, positive earnings reports tend to calm the market and lower the VIX. Central bank policies, such as interest rate decisions and quantitative easing, also affect the VIX. Changes in these policies can alter the risk appetite of investors and influence market volatility.
The speed at which these events impact the VIX is notable. The VIX is designed to be a real-time indicator. It reacts swiftly to new information. A single tweet or headline can be enough to cause a noticeable swing in the VIX. This responsiveness is due to the continuous trading of S&P 500 options. These prices immediately reflect changing market perceptions. How is the vix calculated is important, but it’s equally vital to stay informed about current events and their potential implications for market volatility. The interplay of economic indicators, geopolitical developments, and corporate news creates a complex landscape that drives VIX fluctuations. Successful navigation requires a keen awareness of these factors. By monitoring these influences, investors can gain a better understanding of market sentiment and make more informed decisions.
Utilizing the VIX for Informed Investment Decisions
The Volatility Index (VIX) serves as a valuable tool for investors seeking to enhance their decision-making process. Understanding how is the vix calculated and interpreting its fluctuations can provide insights into market sentiment and potential risks. One key application of the VIX lies in market timing. Elevated VIX levels often signal periods of heightened fear and uncertainty, potentially indicating a market bottom or an opportunity to buy undervalued assets. Conversely, low VIX values may suggest complacency and a potential market top.
Risk management is another area where the VIX proves useful. By monitoring VIX levels, investors can gauge the overall level of risk in the market and adjust their portfolio accordingly. For example, during times of high VIX, reducing exposure to risky assets and increasing allocation to safer investments can help mitigate potential losses. The VIX can also inform hedging strategies. Investors can use options and other derivative instruments to protect their portfolios against market downturns, and the VIX can help determine the appropriate level of hedging needed. Knowing how is the vix calculated provides a deeper understanding of the factors driving options prices, which are fundamental to effective hedging.
While the VIX offers valuable insights, it’s crucial to remember that it is just one piece of the puzzle. The VIX should not be used in isolation but rather in conjunction with other technical indicators, fundamental analysis, and a thorough understanding of macroeconomic conditions. Over-reliance on the VIX without considering other factors can lead to flawed investment decisions. A comprehensive approach that integrates the VIX with other analysis techniques is most likely to improve overall investment strategies and enhance risk-adjusted returns. Ultimately, grasping how is the vix calculated empowers investors to interpret market signals more effectively, leading to more informed and strategic investment choices. Remember that the VIX reflects investor expectations, providing a probabilistic outlook rather than a guaranteed prediction. This understanding is paramount for responsible and effective utilization of the VIX in investment management.


