What is Stock Float and Why Does it Matter?
In the world of stock trading, understanding the concept of stock float is crucial for making informed investment decisions. Stock float, also known as floating stock, refers to the number of shares available for trading in the market. It’s a critical metric that can significantly impact a company’s stock price and trading volume. But what exactly is stock float, and how does it differ from total shares outstanding?

Click Image to Find Quantum Products
To answer this, let’s dive into the definition of stock float. Stock float represents the number of shares that are available for the public to buy and sell. This excludes shares held by company insiders, such as executives and employees, as well as shares held by institutional investors. On the other hand, total shares outstanding include all shares issued by the company, regardless of who holds them.
So, why does stock float matter? For one, it affects the liquidity of a stock, making it easier or harder to buy and sell shares. A higher stock float typically indicates higher liquidity, which can lead to more stable stock prices. Additionally, stock float can influence trading decisions, as investors may be more likely to invest in companies with a higher float due to the increased liquidity. Knowing how to find stock float can give investors an edge in making informed investment decisions.
Understanding the Float Calculation Formula
Calculating stock float is a crucial step in understanding a company’s liquidity and making informed investment decisions. The float calculation formula is relatively simple, but it requires attention to detail and access to the right data points. In this section, we’ll break down the step-by-step process of calculating stock float and provide guidance on where to find the necessary data.
The float calculation formula is as follows:
Float = Total Shares Outstanding – Restricted Shares – Institutional Holdings
To calculate the float, you’ll need to gather the following data points:
- Total Shares Outstanding: This can be found in a company’s annual report (10-K) or quarterly report (10-Q) filed with the Securities and Exchange Commission (SEC).
- Restricted Shares: These are shares held by company insiders, such as executives and employees, that are not available for public trading. This information can be found in the company’s proxy statement or insider ownership reports.
- Institutional Holdings: These are shares held by institutional investors, such as mutual funds, pension funds, and hedge funds. This information can be found in the company’s institutional ownership reports or through financial data providers.
Once you have gathered the necessary data, simply subtract the restricted shares and institutional holdings from the total shares outstanding to arrive at the float. For example, if a company has 10 million total shares outstanding, 2 million restricted shares, and 1 million institutional holdings, the float would be 7 million shares.
Knowing how to find stock float is essential for investors, as it can help identify potential trading opportunities and inform investment decisions. In the next section, we’ll discuss where to find reliable float data and how to analyze it for informed investment decisions.

Where to Find Reliable Float Data
Accurate float data is essential for making informed investment decisions. However, finding reliable sources of float data can be a challenge. In this section, we’ll explore the best sources of float data and provide guidance on how to access them.
One of the most reliable sources of float data is the company’s own reports and filings. The Securities and Exchange Commission (SEC) requires publicly traded companies to file regular reports, including the 10-K and 10-Q, which provide detailed information on the company’s shares outstanding, restricted shares, and institutional holdings. These reports can be accessed through the SEC’s EDGAR database.
Financial websites, such as Yahoo Finance, Google Finance, and Bloomberg, also provide float data for publicly traded companies. These websites aggregate data from various sources, including company reports, stock exchanges, and financial databases. While the data may not always be up-to-date, it can provide a useful starting point for investors.
Stock exchanges, such as the New York Stock Exchange (NYSE) and the NASDAQ, also provide float data for listed companies. This data can be accessed through the exchange’s website or through financial data providers.
In addition to these sources, investors can also use financial data providers, such as Thomson Reuters and S&P Global, to access float data. These providers offer comprehensive datasets and analytics tools that can help investors analyze float data and make informed investment decisions.
When searching for float data, it’s essential to ensure that the data is accurate and up-to-date. Investors should avoid relying on outdated data or sources that may not be reliable. By using these sources and understanding how to find stock float, investors can gain valuable insights into a company’s liquidity and make more informed investment decisions.
How to Analyze Float Data for Informed Investment Decisions
Once you have obtained reliable float data, the next step is to analyze it to gain valuable insights into a company’s liquidity and make informed investment decisions. In this section, we’ll explore how to interpret float data and identify potential trading opportunities.
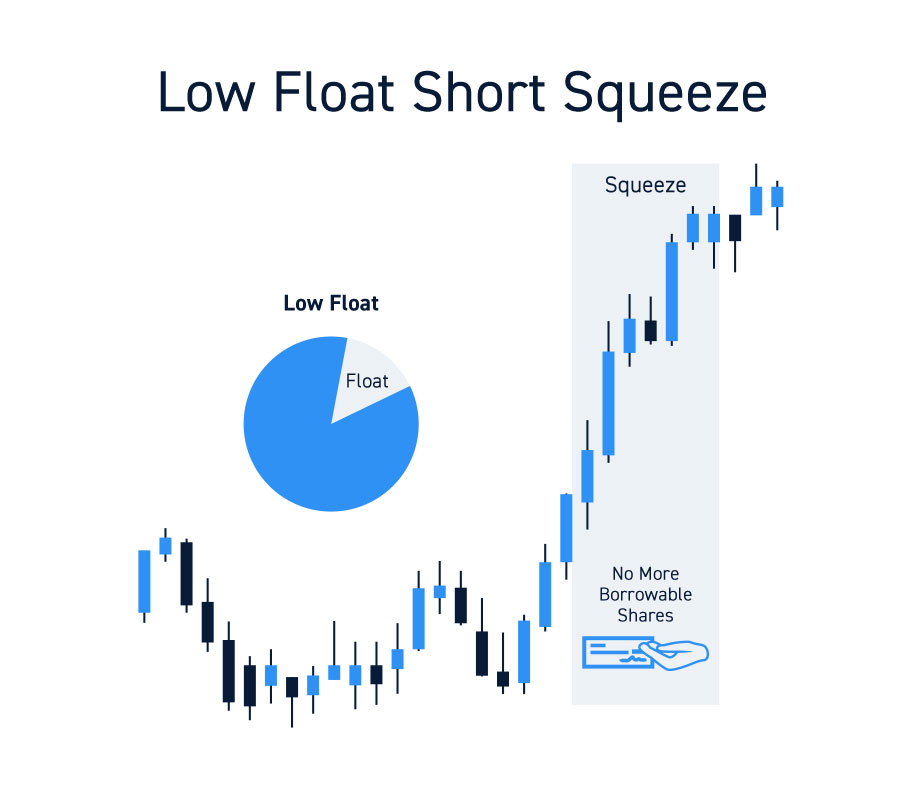
A high float indicates that a large portion of a company’s shares are available for trading, which can lead to increased liquidity and lower volatility. This can be beneficial for investors who want to buy or sell shares quickly and at a stable price. On the other hand, a low float can lead to reduced liquidity and higher volatility, making it more challenging to enter or exit a position.
When analyzing float data, it’s essential to consider the company’s industry, market capitalization, and trading volume. For example, a company with a high float in a highly liquid industry, such as technology, may be more attractive to investors than a company with a low float in a less liquid industry, such as real estate.
Float data can also be used to identify potential trading opportunities. For instance, a company with a low float and high short interest may be a prime target for a short squeeze, where the stock price surges as short sellers scramble to cover their positions. Conversely, a company with a high float and low short interest may be a good candidate for a long position, as there is less downward pressure on the stock price.
To get the most out of float data, investors should also consider other metrics, such as the company’s financial performance, management team, and industry trends. By combining these metrics with float data, investors can gain a more comprehensive understanding of a company’s liquidity and make more informed investment decisions.
By learning how to find stock float and analyzing the data effectively, investors can gain a competitive edge in the market and make more informed investment decisions. In the next section, we’ll explore the role of short selling in stock float and how it can impact investment decisions.

The Role of Short Selling in Stock Float
Short selling is a trading strategy that involves selling securities that an investor does not own, with the expectation of buying them back at a lower price to realize a profit. In the context of stock float, short selling can have a significant impact on the float and, consequently, on investment decisions.
When short sellers enter a position, they borrow shares from a broker or another investor and sell them on the market. This increases the supply of shares available for trading, which can lead to a temporary increase in the float. However, if the short sellers are unable to cover their positions, they may be forced to buy back the shares, which can lead to a surge in demand and a subsequent increase in the stock price.
The relationship between short selling and stock float is complex and can have both positive and negative implications for investors. On the one hand, short selling can increase the float, making it easier for investors to buy and sell shares. On the other hand, short selling can also lead to increased volatility and downward pressure on the stock price, making it more challenging for investors to enter or exit a position.
Investors can use short selling data to gain insights into market sentiment and identify potential trading opportunities. For example, a high short interest ratio, which is the ratio of short shares to float, may indicate that a stock is overvalued and due for a correction. Conversely, a low short interest ratio may indicate that a stock is undervalued and has potential for growth.
When analyzing short selling data, it’s essential to consider the context in which it is being used. For instance, a high short interest ratio in a company with a low float may be more significant than a high short interest ratio in a company with a high float. By understanding the relationship between short selling and stock float, investors can make more informed investment decisions and avoid potential pitfalls.
In the next section, we’ll explore the connection between stock float and market capitalization, including how changes in float can impact market capitalization and vice versa.

Float and Market Capitalization: What’s the Connection?
The relationship between stock float and market capitalization is a crucial aspect of understanding the stock market. Market capitalization, or market cap, is the total value of a company’s outstanding shares, calculated by multiplying the total shares outstanding by the current market price. Stock float, on the other hand, is the number of shares available for trading.
There is a direct correlation between stock float and market capitalization. A company with a high float tends to have a higher market capitalization, as more shares are available for trading, which can lead to increased liquidity and a higher market value. Conversely, a company with a low float may have a lower market capitalization, as fewer shares are available for trading, which can lead to reduced liquidity and a lower market value.
Changes in stock float can also impact market capitalization. For example, if a company announces a stock buyback program, which reduces the number of shares outstanding, the float will decrease, leading to a potential increase in market capitalization. On the other hand, if a company issues new shares, the float will increase, leading to a potential decrease in market capitalization.
Understanding the connection between stock float and market capitalization is essential for investors, as it can help them make more informed investment decisions. For instance, a company with a high float and low market capitalization may be undervalued, while a company with a low float and high market capitalization may be overvalued.
In addition, investors can use the float-to-market-cap ratio to identify potential trading opportunities. This ratio is calculated by dividing the float by the market capitalization. A high ratio may indicate that a stock is undervalued, while a low ratio may indicate that a stock is overvalued.
By understanding the correlation between stock float and market capitalization, investors can gain valuable insights into a company’s liquidity and market value, which can help them make more informed investment decisions. In the next section, we’ll discuss common mistakes to avoid when analyzing stock float.

Common Mistakes to Avoid When Analyzing Stock Float
When analyzing stock float, it’s essential to avoid common pitfalls that can lead to inaccurate conclusions and poor investment decisions. Here are some common mistakes to avoid:
Relying on outdated data: Stock float data can change rapidly, and relying on outdated information can lead to incorrect assumptions about a company’s liquidity and market value. Make sure to use the most recent data available from reliable sources.
Misunderstanding the calculation formula: The stock float calculation formula is straightforward, but it’s easy to make mistakes. Ensure that you understand the formula and use the correct data points to calculate the float accurately.
Ignoring the difference between total shares outstanding and float: Total shares outstanding and float are often confused, but they are distinct concepts. Make sure to understand the difference between the two and use the correct data points in your analysis.
Failing to consider the context: Stock float should be analyzed in the context of the company’s overall financial health, industry trends, and market conditions. Failing to consider these factors can lead to an incomplete understanding of the company’s liquidity and market value.
Not accounting for restricted shares: Restricted shares, such as those held by company insiders, are not available for trading and should be excluded from the float calculation. Failing to account for restricted shares can lead to an inaccurate float calculation.
By avoiding these common mistakes, investors can ensure that their analysis of stock float is accurate and reliable, providing a solid foundation for informed investment decisions. In the next section, we’ll provide a real-world example of how to find and analyze stock float data for a specific company.

Putting it All Together: A Real-World Example of Finding Stock Float
Let’s take a concrete example of how to find and analyze stock float data for a specific company. We’ll use Apple Inc. (AAPL) as our example.
Step 1: Find the Total Shares Outstanding
To calculate the stock float, we need to find the total shares outstanding. We can find this information in Apple’s latest quarterly report (10-Q) or annual report (10-K) filed with the Securities and Exchange Commission (SEC). According to Apple’s latest 10-Q report, the total shares outstanding are 4,275,000,000.
Step 2: Identify Restricted Shares
Next, we need to identify the restricted shares, which are not available for trading. Restricted shares include shares held by company insiders, such as executives and directors, as well as shares held in employee stock option plans. According to Apple’s proxy statement, the total restricted shares are 150,000,000.
Step 3: Calculate the Stock Float
Now, we can calculate the stock float using the formula: Stock Float = Total Shares Outstanding – Restricted Shares. Plugging in the numbers, we get: Stock Float = 4,275,000,000 – 150,000,000 = 4,125,000,000.
Step 4: Analyze the Stock Float
With the stock float calculated, we can analyze the data to gain insights into Apple’s liquidity and market value. A high stock float, such as Apple’s, indicates high liquidity and a large number of shares available for trading. This can make it easier for investors to buy and sell shares, which can lead to a more stable stock price.
By following these steps, investors can find and analyze stock float data for any publicly traded company. Remember to always use reliable sources, such as SEC filings and financial websites, to ensure accurate data. By understanding how to find stock float, investors can make more informed investment decisions and gain a competitive edge in the market.