What is the Dow Jones Industrial Average?
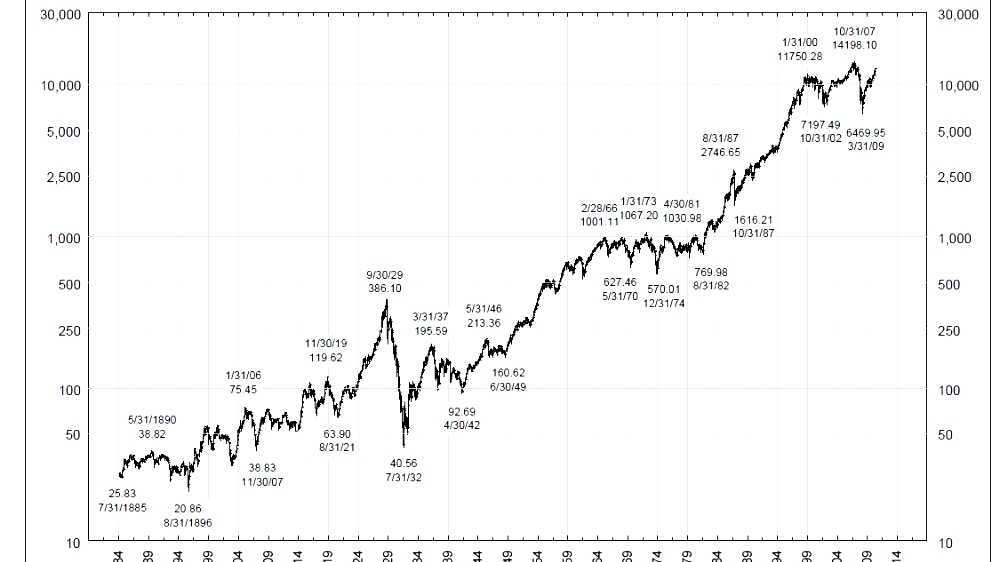
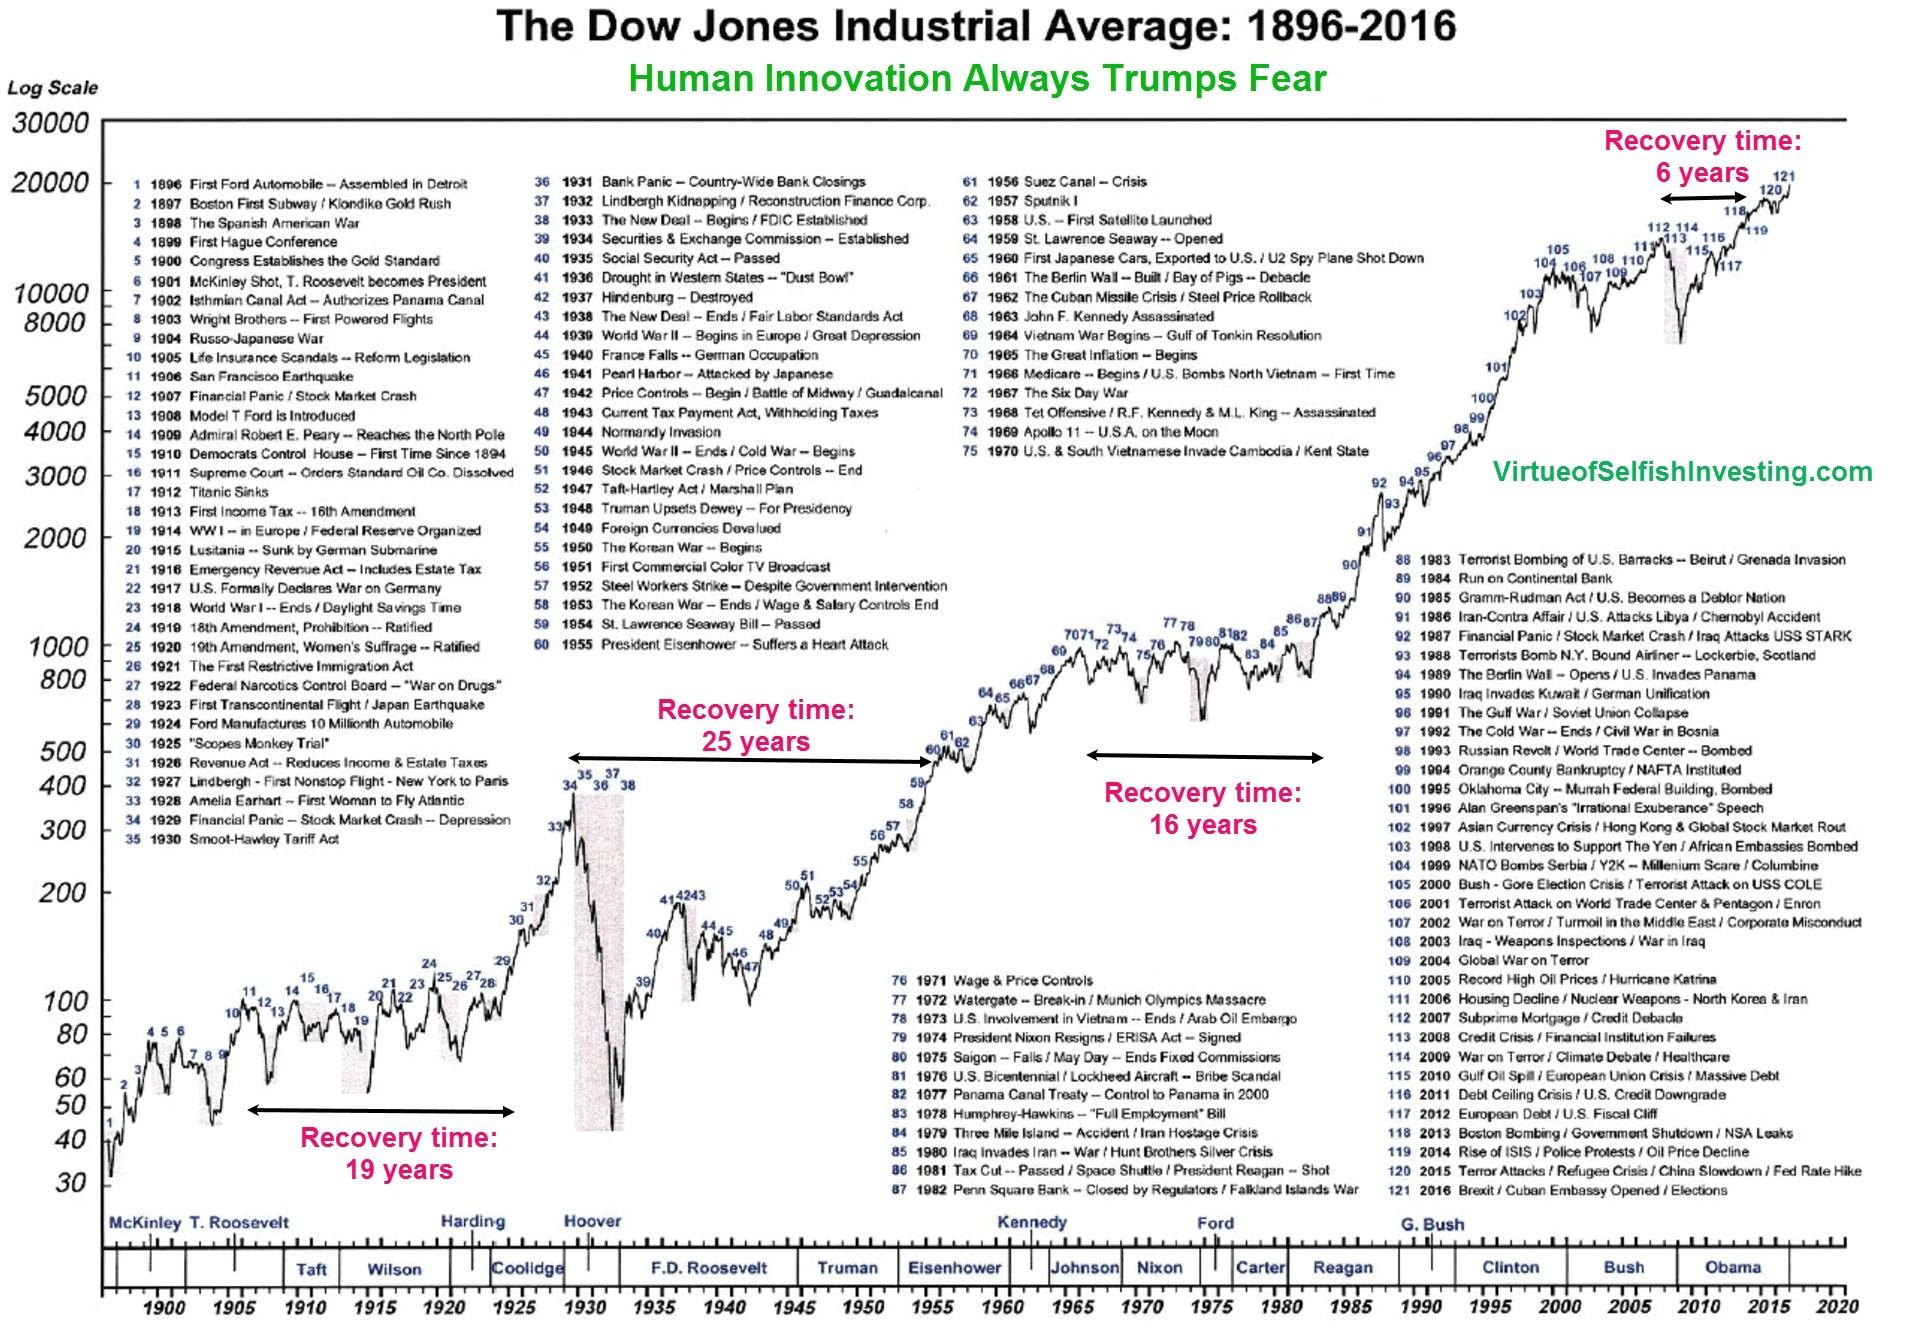
The Dow Jones Industrial Average (DJIA) is a widely followed stock market index that tracks the performance of 30 large, publicly traded companies in the United States. Also known as the Dow, it is considered a benchmark for the overall health of the US stock market. The DJIA was first introduced in 1896 by Charles Dow, a co-founder of Dow Jones & Company, and has since become a leading indicator of market trends and sentiment.
The DJIA is a price-weighted average, meaning that the stocks with higher prices have a greater influence on the index’s value. The 30 component companies are selected by the editors of The Wall Street Journal, who consider factors such as market size, industry representation, and financial performance. The DJIA is calculated and maintained by S&P Dow Jones Indices, a division of S&P Global.
As a widely followed index, the DJIA is often used as a proxy for the overall US stock market. It is frequently cited in financial news and is used by investors, analysts, and researchers to gauge market performance and make informed investment decisions. The DJIA is also used as a benchmark for investment portfolios and is often compared to other stock market indices, such as the S&P 500 and the Nasdaq Composite.
How to Find the Symbol for the Dow Jones Industrial Average
Finding the symbol for the Dow Jones Industrial Average is a straightforward process that can be done through various online platforms and financial websites. The symbol for the Dow Jones Industrial Average is ^DJI, and it is widely used by investors, analysts, and researchers to track the performance of the US stock market.
To find the symbol for the Dow Jones Industrial Average, you can follow these steps:
1. Search online: Simply type “Dow Jones Industrial Average symbol” or “symbol for Dow Jones Industrial Average” in a search engine like Google, and you will find the answer.
2. Check financial websites: Websites like Yahoo Finance, Bloomberg, and CNBC provide real-time data and information on the Dow Jones Industrial Average, including its symbol.
3. Visit stock exchange platforms: The Dow Jones Industrial Average is listed on major stock exchanges, including the New York Stock Exchange (NYSE) and the NASDAQ. You can visit their websites to find the symbol for the Dow Jones Industrial Average.
Knowing the symbol for the Dow Jones Industrial Average is essential for staying up-to-date with market trends and making informed investment decisions. By using the symbol ^DJI, you can easily track the performance of the US stock market and make data-driven decisions.
The Importance of Knowing the Dow Jones Symbol
Knowing the symbol for the Dow Jones Industrial Average is crucial for investors, analysts, and researchers who want to stay up-to-date with market trends and make informed investment decisions. The symbol for the Dow Jones Industrial Average, ^DJI, is a widely recognized and closely followed indicator of the US stock market’s performance.
One of the primary benefits of knowing the symbol for the Dow Jones Industrial Average is that it allows investors to track the performance of the US stock market in real-time. By monitoring the symbol ^DJI, investors can quickly respond to changes in the market and make adjustments to their portfolios as needed.
In addition to tracking market performance, knowing the symbol for the Dow Jones Industrial Average is also essential for making informed investment decisions. By analyzing the symbol ^DJI, investors can identify trends, patterns, and correlations that can inform their investment strategies and help them achieve their financial goals.
Furthermore, knowing the symbol for the Dow Jones Industrial Average is important for tracking portfolio performance. By using the symbol ^DJI as a benchmark, investors can evaluate the performance of their portfolios and make adjustments to optimize their returns.
In today’s fast-paced and rapidly changing financial markets, having access to timely and accurate information is critical. Knowing the symbol for the Dow Jones Industrial Average provides investors with a powerful tool for navigating the complexities of the US stock market and making informed investment decisions.
Understanding the Composition of the Dow Jones Industrial Average
The Dow Jones Industrial Average (DJIA) is a price-weighted average of 30 blue-chip stocks that are selected by the editors of The Wall Street Journal. These 30 stocks are considered to be representative of the US stock market and are widely followed by investors and analysts.
The selection of the 30 stocks that make up the DJIA is based on a number of factors, including market size, liquidity, and industry representation. The stocks are selected to provide a broad representation of the US economy and to reflect the market’s performance.
The 30 stocks that make up the DJIA are weighted by their prices, with higher-priced stocks having a greater influence on the index’s value. This means that the stocks with higher prices have a greater impact on the DJIA’s performance, while lower-priced stocks have a smaller impact.
The composition of the DJIA is reviewed and updated quarterly to ensure that it remains a representative benchmark of the US stock market. This review process involves evaluating the market capitalization, liquidity, and industry representation of the current constituents, as well as considering potential new additions to the index.
Some of the well-known companies that are currently part of the DJIA include Apple, Microsoft, Johnson & Johnson, Coca-Cola, and McDonald’s. These companies are leaders in their respective industries and are widely recognized as bellwethers of the US economy.
Understanding the composition of the DJIA is important for investors and analysts who want to gain insights into the performance of the US stock market. By knowing the 30 stocks that make up the index, investors can gain a better understanding of the market’s trends and patterns, and make more informed investment decisions.
In addition, the symbol for the Dow Jones Industrial Average, ^DJI, is widely followed and provides a convenient way to track the performance of the US stock market. By monitoring the symbol ^DJI, investors can quickly respond to changes in the market and make adjustments to their portfolios as needed.
The Role of the Dow Jones in Investment Decisions
The Dow Jones Industrial Average (DJIA) plays a crucial role in investment decisions, serving as a benchmark, a gauge of market sentiment, and a tool for diversification. The symbol for the Dow Jones Industrial Average, ^DJI, is widely followed and provides a convenient way to track the performance of the US stock market.
As a benchmark, the DJIA provides a standard against which investment portfolios can be measured. By comparing the performance of a portfolio to the DJIA, investors can evaluate their investment decisions and make adjustments as needed. The DJIA is also used as a benchmark for index funds and exchange-traded funds (ETFs), which track the performance of the index.
The DJIA is also a gauge of market sentiment, providing insights into the overall direction of the market. By tracking the symbol ^DJI, investors can gain a sense of whether the market is trending upwards or downwards, and make investment decisions accordingly. The DJIA is also used to gauge the performance of other stock market indices, such as the S&P 500 and the Nasdaq Composite.
In addition, the DJIA is a tool for diversification, providing a way to spread risk across different asset classes and industries. By investing in a diversified portfolio that tracks the DJIA, investors can reduce their exposure to individual stocks and industries, and increase their potential returns.
The DJIA is also used in asset allocation, helping investors to determine the optimal mix of stocks, bonds, and other assets in their portfolios. By tracking the symbol ^DJI, investors can gain insights into the performance of different asset classes and make informed decisions about their investment mix.
Furthermore, the DJIA is used in risk management, providing a way to measure and manage risk in investment portfolios. By tracking the symbol ^DJI, investors can gain insights into the potential risks and returns of different investments, and make informed decisions about their risk tolerance.
In conclusion, the DJIA plays a critical role in investment decisions, serving as a benchmark, a gauge of market sentiment, and a tool for diversification. By understanding the role of the DJIA and its symbol ^DJI, investors can make more informed investment decisions and achieve their financial goals.
Common Misconceptions About the Dow Jones Symbol
Despite its widespread use and recognition, the symbol for the Dow Jones Industrial Average, ^DJI, is often misunderstood or misinterpreted. This section aims to address some common misconceptions about the Dow Jones symbol and provide a clearer understanding of its role in the financial market.
One common misconception is that the Dow Jones symbol is directly related to other stock market indices, such as the S&P 500 or the Nasdaq Composite. While these indices are all used to track the performance of the US stock market, they are distinct and separate entities, each with their own methodology and composition. The Dow Jones symbol, ^DJI, specifically tracks the performance of the 30 blue-chip stocks that make up the DJIA.
Another misconception is that the Dow Jones symbol has a direct impact on individual stocks. While the DJIA is a widely followed index, its performance does not directly affect the stock prices of individual companies. Instead, the DJIA provides a broader perspective on the overall market trend and sentiment.
Some investors also believe that the Dow Jones symbol is only relevant for large-cap stocks or established companies. However, the DJIA is designed to be a representative benchmark of the US stock market, and its composition includes a diverse range of companies across various industries and sectors.
Furthermore, some investors may think that the Dow Jones symbol is only useful for short-term trading or speculation. However, the DJIA is a long-term benchmark that provides valuable insights into the overall market trend and sentiment, making it a useful tool for investors with a long-term perspective.
By understanding these common misconceptions, investors can gain a clearer understanding of the role of the Dow Jones symbol in the financial market and make more informed investment decisions. The symbol for the Dow Jones Industrial Average, ^DJI, is a powerful tool that provides valuable insights into the performance of the US stock market, and its importance cannot be overstated.
Using the Dow Jones Symbol in Technical Analysis
Technical analysis is a crucial aspect of investing, and the symbol for the Dow Jones Industrial Average, ^DJI, plays a significant role in this process. By analyzing the chart patterns, trends, and indicators of the Dow Jones symbol, investors can gain valuable insights into the performance of the US stock market and make informed investment decisions.
One of the primary ways to use the Dow Jones symbol in technical analysis is through chart patterns. By analyzing the historical price movements of the ^DJI, investors can identify patterns such as trends, reversals, and continuations. These patterns can provide valuable insights into the potential future direction of the market, allowing investors to make informed decisions about their investments.
Trend analysis is another critical aspect of technical analysis that involves the Dow Jones symbol. By analyzing the long-term and short-term trends of the ^DJI, investors can gain insights into the overall direction of the market and make decisions about their investment strategy. For example, a strong uptrend in the Dow Jones symbol may indicate a bullish market, while a downtrend may indicate a bearish market.
Indicator calculations are also an essential part of technical analysis that involves the Dow Jones symbol. Indicators such as the Relative Strength Index (RSI), Moving Averages, and Bollinger Bands can be used to analyze the performance of the ^DJI and provide insights into the market’s sentiment and trend. For example, an RSI reading above 70 may indicate that the market is overbought, while a reading below 30 may indicate that it is oversold.
In addition, the Dow Jones symbol can be used in technical analysis to identify support and resistance levels. By analyzing the historical price movements of the ^DJI, investors can identify key levels of support and resistance, which can provide valuable insights into the potential future direction of the market.
Furthermore, the Dow Jones symbol can be used in technical analysis to identify divergences between the market’s price action and its indicators. For example, if the ^DJI is making new highs, but its RSI is failing to reach new highs, it may indicate a divergence between the market’s price action and its momentum, which can be a sign of a potential reversal.
In conclusion, the symbol for the Dow Jones Industrial Average, ^DJI, plays a critical role in technical analysis, providing valuable insights into the performance of the US stock market and allowing investors to make informed investment decisions. By analyzing the chart patterns, trends, and indicators of the Dow Jones symbol, investors can gain a deeper understanding of the market and make more informed investment decisions.
Staying Ahead of the Curve with the Dow Jones Symbol
Staying informed about the Dow Jones Industrial Average and its symbol, ^DJI, is crucial for investors and market enthusiasts alike. By staying up-to-date with market news and trends, investors can make informed decisions and stay ahead of the curve. In this section, we will provide tips on how to stay informed about the Dow Jones Industrial Average and its symbol.
One of the most effective ways to stay informed about the Dow Jones Industrial Average is to follow reputable financial news sources and websites. These sources provide real-time updates on market trends, news, and analysis, allowing investors to stay informed about the performance of the ^DJI.
Another way to stay informed is to set up customized alerts and notifications on financial websites and platforms. These alerts can provide investors with real-time updates on the performance of the ^DJI, allowing them to make informed decisions quickly.
In addition, investors can also follow financial experts and analysts on social media and financial forums. These experts often provide valuable insights and analysis on the performance of the ^DJI, allowing investors to stay informed and make informed decisions.
Furthermore, investors can also use financial apps and tools to stay informed about the Dow Jones Industrial Average. These apps and tools provide real-time data and analysis on the performance of the ^DJI, allowing investors to make informed decisions on-the-go.
Finally, investors can also stay informed about the Dow Jones Industrial Average by reading books and articles on the topic. These resources provide in-depth analysis and insights on the performance of the ^DJI, allowing investors to gain a deeper understanding of the market.
In conclusion, staying informed about the Dow Jones Industrial Average and its symbol, ^DJI, is crucial for investors and market enthusiasts alike. By following reputable financial news sources, setting up customized alerts, following financial experts, using financial apps and tools, and reading books and articles, investors can stay ahead of the curve and make informed decisions.


:max_bytes(150000):strip_icc()/DowJonesIndustrialAverage-af0c386c72c74e05b1ccc563b4a0ea06.jpg)

