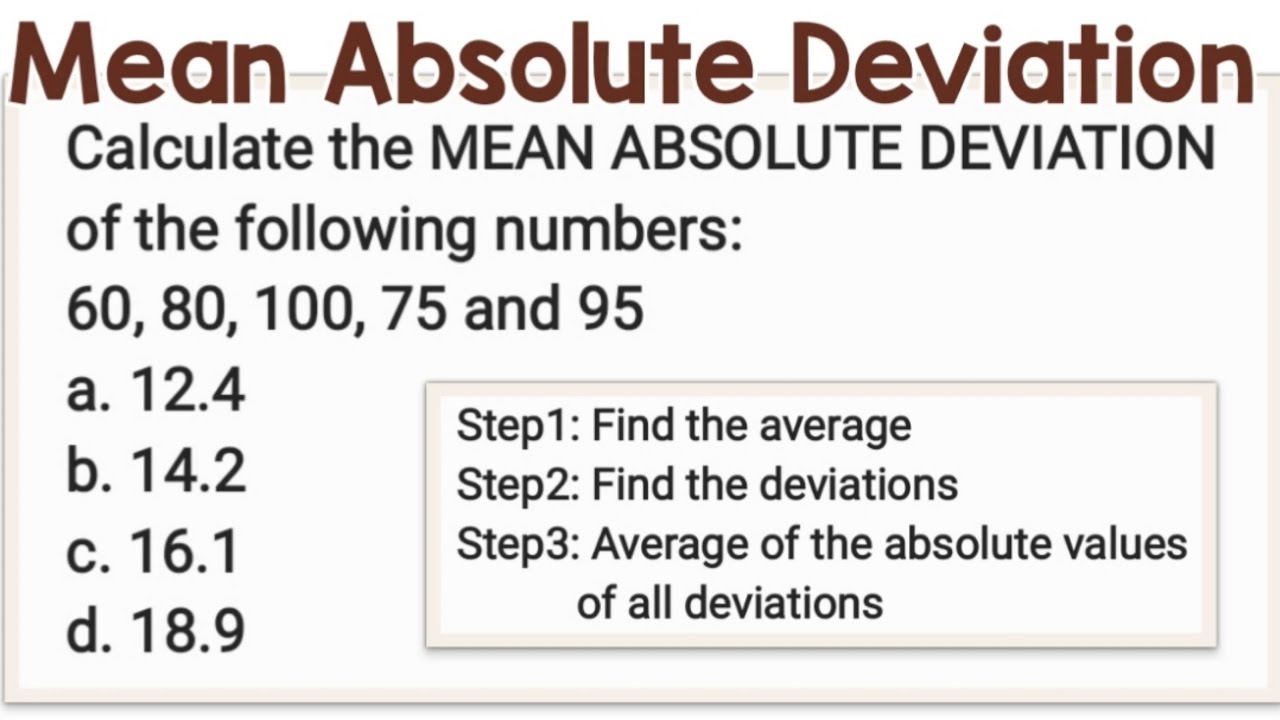
Understanding the Concept of Mean Absolute Deviation
In statistical analysis, mean absolute deviation (MAD) is a crucial measure of data dispersion that calculates the average distance of data points from the mean. This measure is essential in understanding the variability of a dataset, as it provides a more accurate representation of data spread compared to other measures, such as range or interquartile range. In Excel, MAD is a valuable tool for data analysis, as it can help identify patterns and trends in data, and inform data-driven decisions. By using mean absolute deviation in Excel, analysts can gain insights into the spread of their data, identify outliers, and make informed decisions. In this article, we will explore the concept of MAD, its importance in statistical analysis, and how to calculate it in Excel.

Click Image to Find Quantum Products
:max_bytes(150000):strip_icc()/absolute-deviation-58594c183df78ce2c323da49.jpg)
Why Use Mean Absolute Deviation in Excel?
When it comes to measuring data dispersion, there are several options available, including standard deviation, range, and interquartile range. However, mean absolute deviation (MAD) stands out as a preferred choice in many cases, especially when working with mean absolute deviation in Excel. One of the primary advantages of MAD is its ability to provide a more accurate representation of data variability, particularly when dealing with non-normal or skewed distributions. This is because MAD is a more robust measure that is less affected by outliers, making it a better choice for datasets with extreme values. Additionally, MAD is easier to interpret and understand compared to standard deviation, as it is based on the average distance of data points from the mean. This makes it a more intuitive measure for non-technical stakeholders. By using mean absolute deviation in Excel, analysts can gain a deeper understanding of their data and make more informed decisions.
How to Calculate Mean Absolute Deviation in Excel
To calculate mean absolute deviation (MAD) in Excel, follow these steps:
Step 1: Enter your data in a column, say A1:A10.
Step 2: Calculate the mean of the data using the AVERAGE function: =AVERAGE(A1:A10)
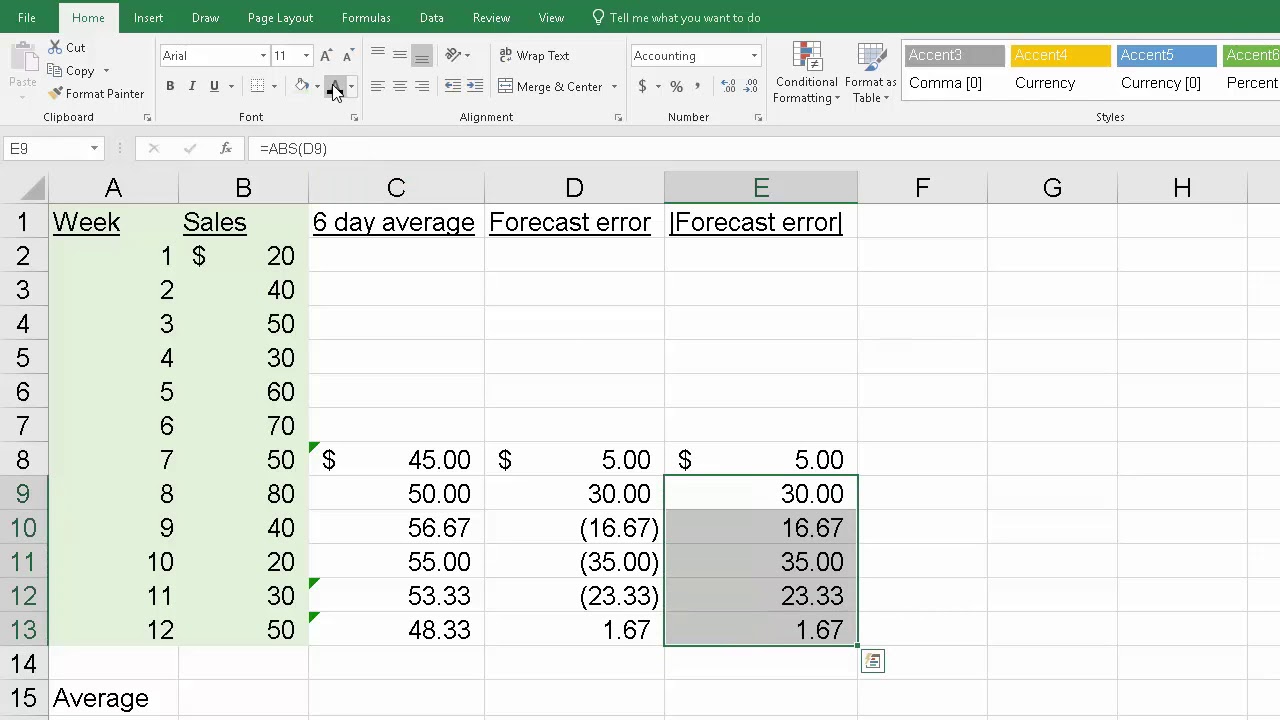
Step 3: Calculate the absolute deviations from the mean using the ABS function: =ABS(A1:A10 – AVERAGE(A1:A10))
Step 4: Calculate the mean of the absolute deviations using the AVERAGE function again: =AVERAGE(ABS(A1:A10 – AVERAGE(A1:A10)))
This will give you the mean absolute deviation (MAD) of your data. You can also use the following formula to calculate MAD in a single step: =AVERAGE(ABS(A1:A10 – AVERAGE(A1:A10)))
For example, if your data is in cells A1:A10, the formula would be: =AVERAGE(ABS(A1:A10 – AVERAGE(A1:A10)))
Once you have calculated the MAD, you can use it to analyze the dispersion of your data and make informed decisions. Mean absolute deviation in Excel is a powerful tool for data analysis, and by following these steps, you can easily calculate it and gain insights into your data.

Using Excel Formulas to Calculate Mean Absolute Deviation
When it comes to calculating mean absolute deviation (MAD) in Excel, using formulas is an efficient and accurate way to get the job done. Two essential formulas for calculating MAD are the AVERAGE and ABS functions. The AVERAGE function calculates the mean of a dataset, while the ABS function returns the absolute value of a number.
The formula to calculate MAD using AVERAGE and ABS is: =AVERAGE(ABS(range – AVERAGE(range)))
Where “range” is the range of cells containing the data. For example, if your data is in cells A1:A10, the formula would be: =AVERAGE(ABS(A1:A10 – AVERAGE(A1:A10)))
This formula calculates the mean of the absolute deviations from the mean, giving you the mean absolute deviation (MAD) of your data. By using this formula, you can easily calculate MAD in Excel and gain insights into the dispersion of your data.
In addition to the AVERAGE and ABS functions, you can also use the MEDIAN function to calculate MAD. The MEDIAN function returns the median of a dataset, which can be used as an alternative to the mean. The formula to calculate MAD using MEDIAN and ABS is: =MEDIAN(ABS(range – MEDIAN(range)))
Both of these formulas provide an accurate calculation of mean absolute deviation in Excel, allowing you to analyze and understand the dispersion of your data.
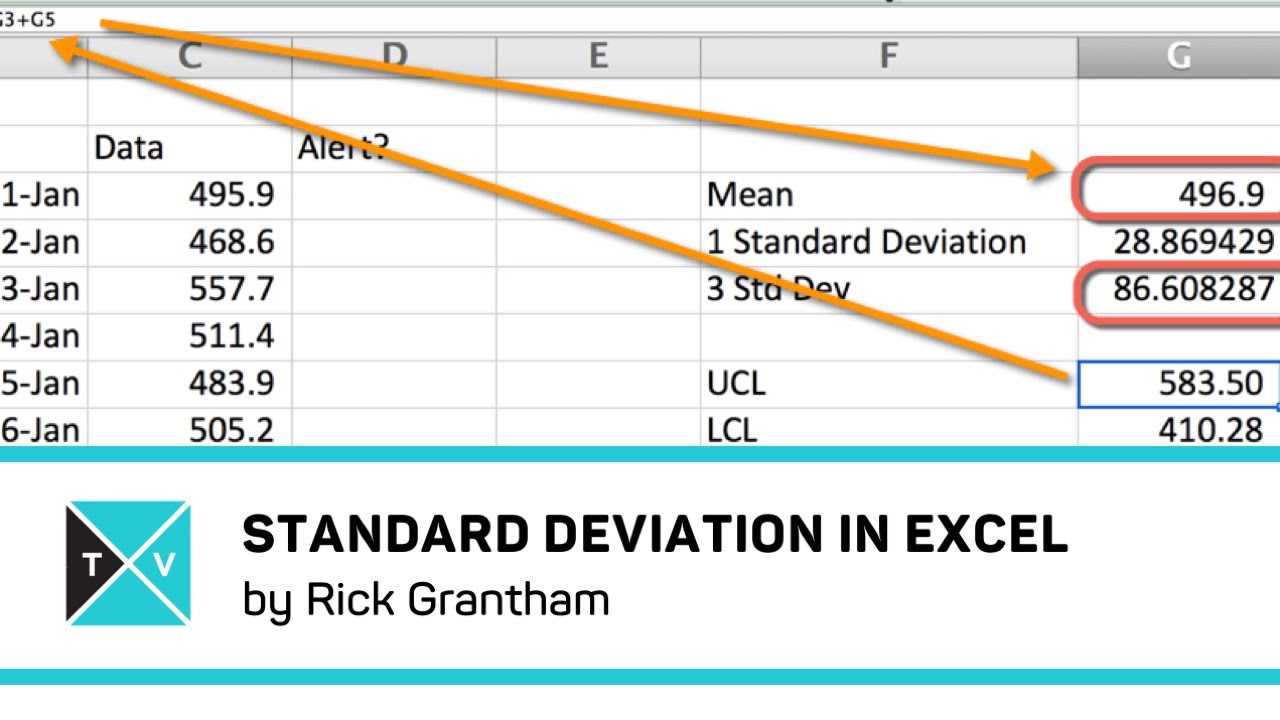
Mean Absolute Deviation vs. Standard Deviation: A Comparison
When it comes to measuring data dispersion in Excel, two popular metrics are mean absolute deviation (MAD) and standard deviation. While both measures provide insights into data variability, they have distinct differences in their calculation, interpretation, and application.
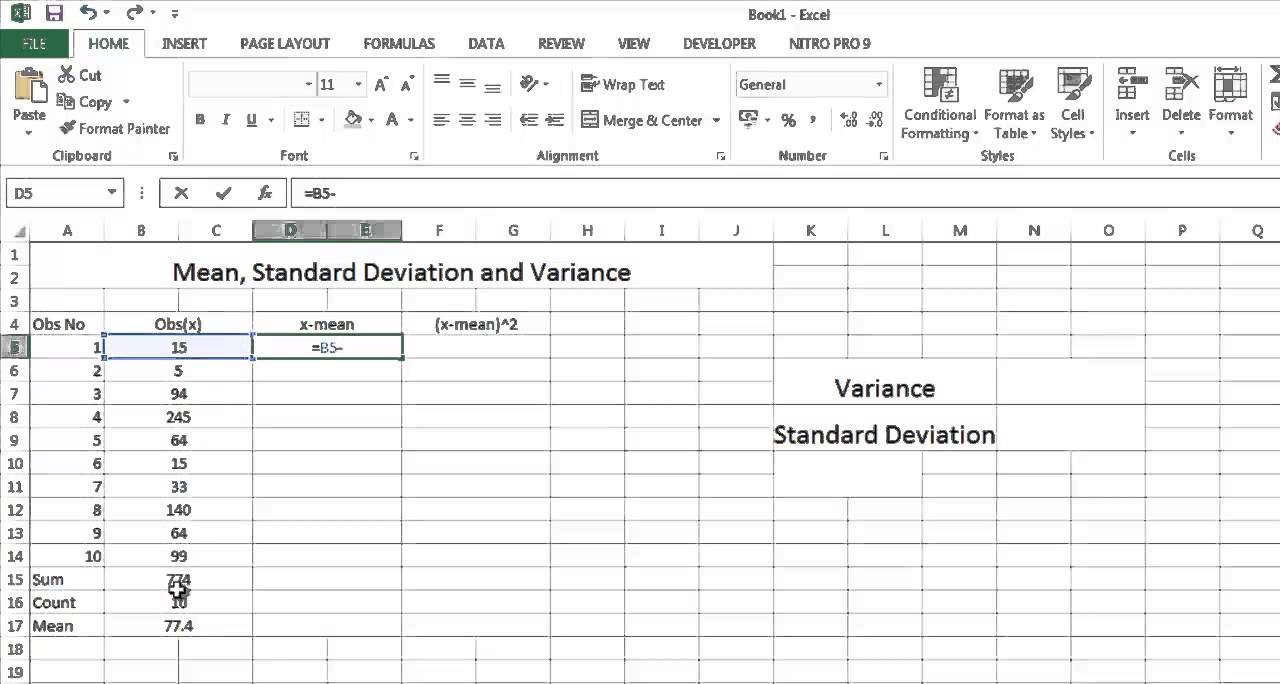
Standard deviation is a widely used measure of dispersion that calculates the square root of the average of the squared differences from the mean. In contrast, mean absolute deviation in Excel calculates the average distance of data points from the mean, without considering the direction of the deviations.
One key advantage of MAD over standard deviation is its robustness to outliers. Since MAD uses absolute values, it is less affected by extreme values in the data. Standard deviation, on the other hand, is more sensitive to outliers, which can skew the results. This makes MAD a more reliable choice when working with datasets that contain outliers.
Another difference between MAD and standard deviation is their interpretation. Standard deviation provides a measure of the spread of the data around the mean, while MAD provides a measure of the average distance of data points from the mean. This makes MAD more intuitive and easier to understand, especially for non-technical stakeholders.
In terms of application, standard deviation is commonly used in statistical modeling and hypothesis testing, while mean absolute deviation in Excel is often used in quality control, finance, and economics to measure the variability of processes and systems.
In conclusion, while both MAD and standard deviation are useful measures of data dispersion, they have distinct differences in their calculation, interpretation, and application. By understanding these differences, users can choose the most appropriate metric for their specific needs and make more informed data-driven decisions.
Real-World Applications of Mean Absolute Deviation in Excel
Mean absolute deviation in Excel has numerous real-world applications across various industries, including finance, economics, and quality control. In these fields, MAD is used to measure the variability of processes and systems, informing business decisions and driving improvement.
In finance, MAD is used to analyze the volatility of stock prices, returns, and other financial metrics. By calculating the mean absolute deviation in Excel, financial analysts can identify trends and patterns in market data, making more informed investment decisions.
In economics, MAD is used to study the variability of economic indicators, such as GDP, inflation rates, and unemployment rates. By analyzing the mean absolute deviation in Excel, economists can identify patterns and trends in economic data, informing policy decisions and forecasting future economic trends.
In quality control, MAD is used to monitor the variability of manufacturing processes, ensuring that products meet quality standards. By calculating the mean absolute deviation in Excel, quality control engineers can identify deviations from the mean, taking corrective action to improve process efficiency and product quality.
For example, a manufacturing company uses mean absolute deviation in Excel to monitor the variability of its production process. By analyzing the MAD of production metrics, such as cycle time and defect rate, the company can identify areas for improvement, reducing waste and increasing productivity.
In another example, a financial analyst uses mean absolute deviation in Excel to analyze the volatility of a stock portfolio. By calculating the MAD of stock returns, the analyst can identify trends and patterns in the data, making more informed investment decisions and optimizing portfolio performance.
These examples demonstrate the versatility and applicability of mean absolute deviation in Excel, highlighting its value in informing business decisions and driving improvement in various industries.
Troubleshooting Common Issues with Mean Absolute Deviation in Excel
When calculating mean absolute deviation in Excel, users may encounter common issues that can affect the accuracy of their results. In this section, we will address these issues and provide solutions to help users overcome them.
One common issue is handling missing data. When calculating mean absolute deviation in Excel, missing data can lead to inaccurate results. To address this, users can use the IFERROR function to replace missing values with a specific value, such as zero or the mean of the dataset. Alternatively, users can use the AVERAGEA function, which ignores blank cells and calculates the mean of the remaining values.
Another issue is handling outliers. Outliers can significantly affect the mean absolute deviation in Excel, leading to inaccurate results. To address this, users can use the TRIMMEAN function, which calculates the mean of a dataset after removing a specified percentage of outliers. Alternatively, users can use the INTERQUARTILE RANGE function to identify outliers and remove them from the dataset.
Users may also encounter issues with data formatting. For example, if the data is in a text format, the mean absolute deviation in Excel may not calculate correctly. To address this, users can use the VALUE function to convert text values to numerical values.
In addition, users may encounter issues with data range selection. For example, if the data range is not selected correctly, the mean absolute deviation in Excel may not calculate correctly. To address this, users can use the OFFSET function to select the correct data range.
By addressing these common issues, users can ensure that their mean absolute deviation in Excel calculations are accurate and reliable, providing a solid foundation for data-driven decision-making.
Best Practices for Interpreting Mean Absolute Deviation Results
When interpreting mean absolute deviation (MAD) results in Excel, it is essential to follow best practices to ensure accurate and meaningful insights. By doing so, users can unlock the full potential of MAD and make informed data-driven decisions.
Firstly, it is crucial to understand the context of the data. MAD is a measure of dispersion, and its value depends on the scale of the data. Therefore, users should consider the units of measurement and the range of values when interpreting MAD results.
Secondly, users should identify patterns and trends in the data. MAD can help identify outliers, skewness, and other anomalies in the data. By analyzing MAD results, users can determine whether the data follows a normal distribution or if there are any deviations from the mean.
Thirdly, users should consider the magnitude of the MAD value. A small MAD value indicates that the data points are close to the mean, while a large MAD value indicates greater variability. Users can use this information to determine the level of risk or uncertainty associated with the data.
Fourthly, users should compare MAD results with other measures of dispersion, such as standard deviation. This comparison can provide a more comprehensive understanding of the data and help users determine which measure is most suitable for their analysis.
Fifthly, users should use MAD results to inform business decisions. By analyzing MAD results, users can identify areas for improvement, optimize processes, and make data-driven decisions that drive business growth.
For example, in finance, MAD can be used to analyze the volatility of stock prices. By interpreting MAD results, investors can identify trends and patterns in the data, making more informed investment decisions.
In conclusion, by following these best practices, users can unlock the full potential of mean absolute deviation in Excel and make informed data-driven decisions. By interpreting MAD results correctly, users can gain valuable insights into their data and drive business growth.