What is Level 2 Market Data and Why is it Important?
Level 2 market data is a powerful tool that provides traders and investors with a deeper understanding of market dynamics. It offers a more detailed view of the market than traditional Level 1 data, which only displays the best bid and ask prices. By utilizing Level 2 market data, traders can gain valuable insights into market sentiment, identify potential trading opportunities, and make more informed investment decisions. In essence, knowing how to use Level 2 market data can be the key to unlocking a competitive edge in the financial markets.

Click Image to Find Quantum Products
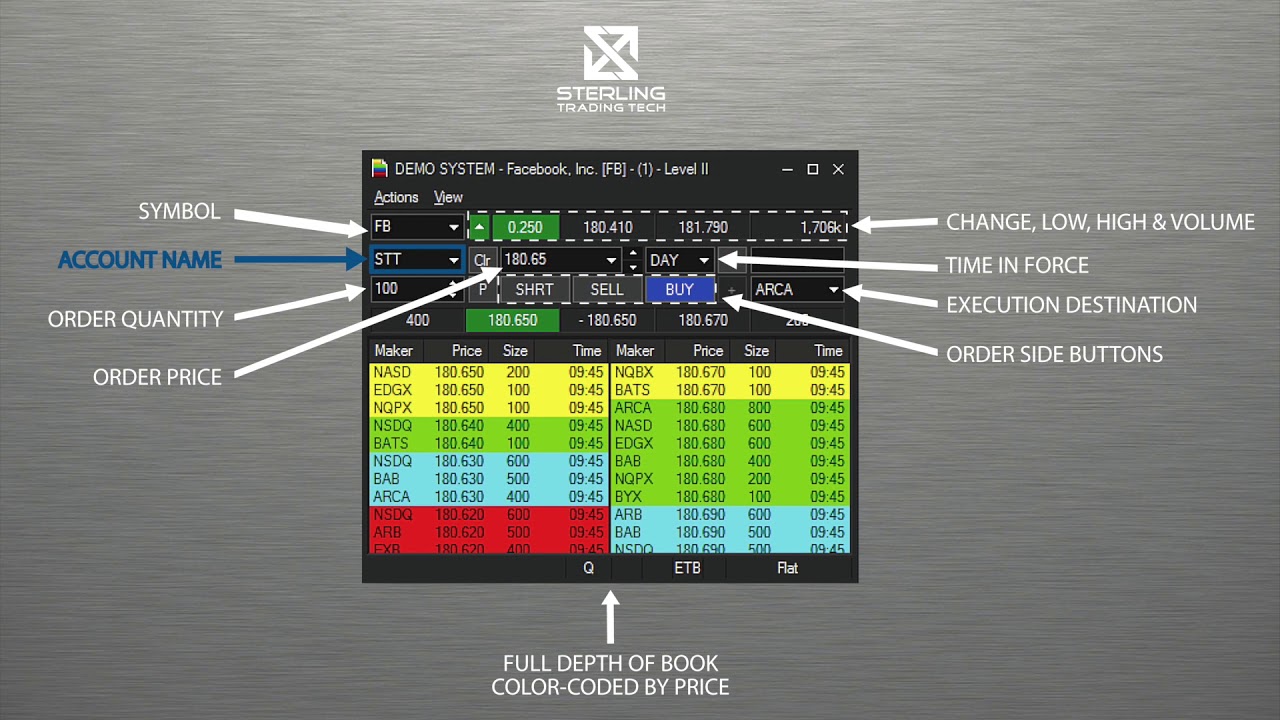
Understanding the Components of Level 2 Data
Level 2 market data is comprised of several key components that provide a detailed view of market dynamics. These components include bid and ask prices, order sizes, and market maker identities. By understanding each of these components, traders can gain valuable insights into market sentiment and make more informed trading decisions. For instance, bid and ask prices can be used to identify potential trading opportunities, while order sizes can indicate market momentum. Market maker identities, on the other hand, can provide insight into the actions of key market participants. Knowing how to use Level 2 market data to analyze these components can be a powerful tool in a trader’s arsenal.
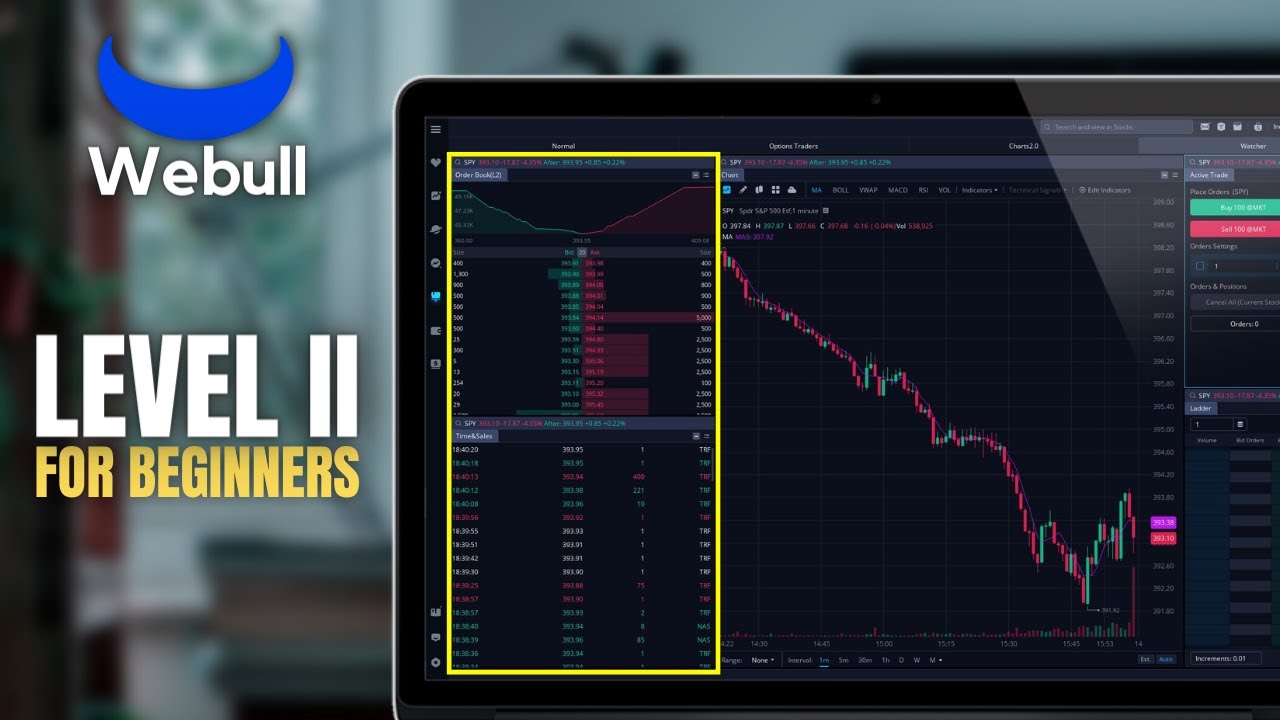
How to Access and Interpret Level 2 Market Data
Accessing and interpreting Level 2 market data is a crucial step in unlocking its potential. There are several popular platforms and tools that provide access to Level 2 data, including trading software, data feeds, and online platforms. Once accessed, interpreting the data requires a combination of technical and analytical skills. To get the most out of Level 2 data, it’s essential to know how to identify trends, patterns, and market sentiment. This can be achieved by analyzing the bid and ask prices, order sizes, and market maker identities. For instance, identifying an imbalance in supply and demand can indicate a potential trading opportunity. Knowing how to use Level 2 market data to identify these opportunities can be a powerful tool in a trader’s arsenal. Additionally, using visualization tools and charts can help to simplify the data and make it easier to interpret. By mastering the skills of accessing and interpreting Level 2 market data, traders can gain a competitive edge in the financial markets.

Using Level 2 Data to Identify Trading Opportunities
One of the primary benefits of Level 2 market data is its ability to identify potential trading opportunities. By analyzing the bid and ask prices, order sizes, and market maker identities, traders can gain valuable insights into market dynamics. For instance, spotting imbalances in supply and demand can indicate a potential trading opportunity. This can be achieved by analyzing the order flow and identifying instances where there is a significant disparity between buy and sell orders. Additionally, identifying market maker activity can provide insight into the actions of key market participants. By knowing how to use Level 2 market data to identify these opportunities, traders can gain a competitive edge in the financial markets. Furthermore, detecting order flow imbalances can help traders anticipate potential price movements and make more informed trading decisions. By mastering the skills of using Level 2 data to identify trading opportunities, traders can increase their chances of success in the financial markets.

Level 2 Data in Practice: Real-World Examples and Case Studies
While understanding the components and benefits of Level 2 market data is essential, seeing it in action can be even more illuminating. Real-world examples and case studies can provide valuable insights into how Level 2 data can be used to inform trading decisions and achieve success in the financial markets. For instance, a hedge fund may use Level 2 data to identify imbalances in supply and demand, allowing them to make more informed investment decisions. Similarly, a day trader may use Level 2 data to detect order flow imbalances, enabling them to anticipate potential price movements and make profitable trades. By examining these real-world examples, traders can gain a deeper understanding of how to use Level 2 market data to gain a competitive edge. Additionally, case studies can provide a detailed analysis of how Level 2 data was used to achieve specific trading goals, offering actionable insights and strategies that can be applied in real-world trading scenarios. By learning from these examples and case studies, traders can develop a more effective approach to using Level 2 market data and improve their overall trading performance.
Common Pitfalls and Challenges of Using Level 2 Market Data
While Level 2 market data can be a powerful tool for traders, it’s not without its challenges. One common pitfall is information overload, where the sheer volume of data can be overwhelming and difficult to interpret. To avoid this, it’s essential to have a clear understanding of what data is relevant to your trading goals and to focus on the most important metrics. Another challenge is data quality issues, where inaccurate or incomplete data can lead to misguided trading decisions. To mitigate this risk, it’s crucial to source Level 2 data from reputable providers and to regularly verify the accuracy of the data. Additionally, traders should be aware of the importance of combining Level 2 data with other forms of analysis, such as technical and fundamental analysis, to gain a more comprehensive understanding of the market. By being aware of these common pitfalls and challenges, traders can take steps to avoid them and maximize the benefits of using Level 2 market data. Furthermore, understanding how to use Level 2 market data effectively requires a deep understanding of the market dynamics and the ability to identify potential trading opportunities. By being mindful of these challenges, traders can develop a more effective approach to using Level 2 market data and improve their overall trading performance.

Best Practices for Integrating Level 2 Data into Your Trading Strategy
When it comes to integrating Level 2 market data into a trading strategy, there are several best practices to keep in mind. First, it’s essential to set clear goals and define risk parameters to ensure that the data is being used to inform trading decisions that align with the overall strategy. Additionally, traders should continuously monitor and adjust their strategy to ensure that it remains effective in the ever-changing market landscape. Another key consideration is to combine Level 2 data with other forms of analysis, such as technical and fundamental analysis, to gain a more comprehensive understanding of the market. By doing so, traders can identify potential trading opportunities and make more informed decisions. Furthermore, understanding how to use Level 2 market data effectively requires a deep understanding of the market dynamics and the ability to identify potential trading opportunities. By following these best practices, traders can maximize the benefits of using Level 2 market data and improve their overall trading performance. For instance, a trader may use Level 2 data to identify imbalances in supply and demand, and then adjust their strategy to take advantage of these imbalances. By doing so, the trader can gain a competitive edge in the market and achieve greater success. By integrating Level 2 market data into a trading strategy, traders can make more informed decisions and stay ahead of the competition.
Staying Ahead of the Curve: Advanced Level 2 Data Analysis Techniques
To truly unlock the power of Level 2 market data, traders and investors must stay ahead of the curve by leveraging advanced analysis techniques. One such technique is the use of machine learning algorithms to identify complex patterns and trends in the data. By applying these algorithms, traders can identify potential trading opportunities that may not be immediately apparent through traditional analysis methods. Another advanced technique is the use of data visualization tools to represent Level 2 market data in a more intuitive and easily digestible format. This can help traders to quickly identify areas of market imbalance and make more informed trading decisions. Additionally, traders can use advanced statistical models to analyze Level 2 data and identify correlations and relationships that may not be immediately apparent. By combining these advanced techniques with a deep understanding of how to use Level 2 market data, traders can gain a significant competitive edge in the financial markets. For instance, a trader may use machine learning algorithms to identify patterns in market maker activity, and then use data visualization tools to represent this data in a more intuitive format. By doing so, the trader can quickly identify potential trading opportunities and make more informed decisions. By staying ahead of the curve and leveraging these advanced techniques, traders can maximize the benefits of using Level 2 market data and achieve greater success in the financial markets.
