Unlocking the Power of Covariance in Data Analysis
In data analysis, understanding the relationship between variables is crucial for making informed decisions. Covariance, a statistical measure, helps analysts identify the linear relationship between two variables. It measures how much two variables change together, providing valuable insights into their interdependence. When analyzing data in Excel, knowing how to find covariance on Excel is essential for data-driven decision-making. By grasping the concept of covariance, analysts can gain a deeper understanding of their data and make more accurate predictions. In this article, we will explore the importance of covariance in data analysis and provide a comprehensive guide on how to calculate it in Excel.

Click Image to Find Quantum Products

Understanding the Formula: A Step-by-Step Guide to Calculating Covariance
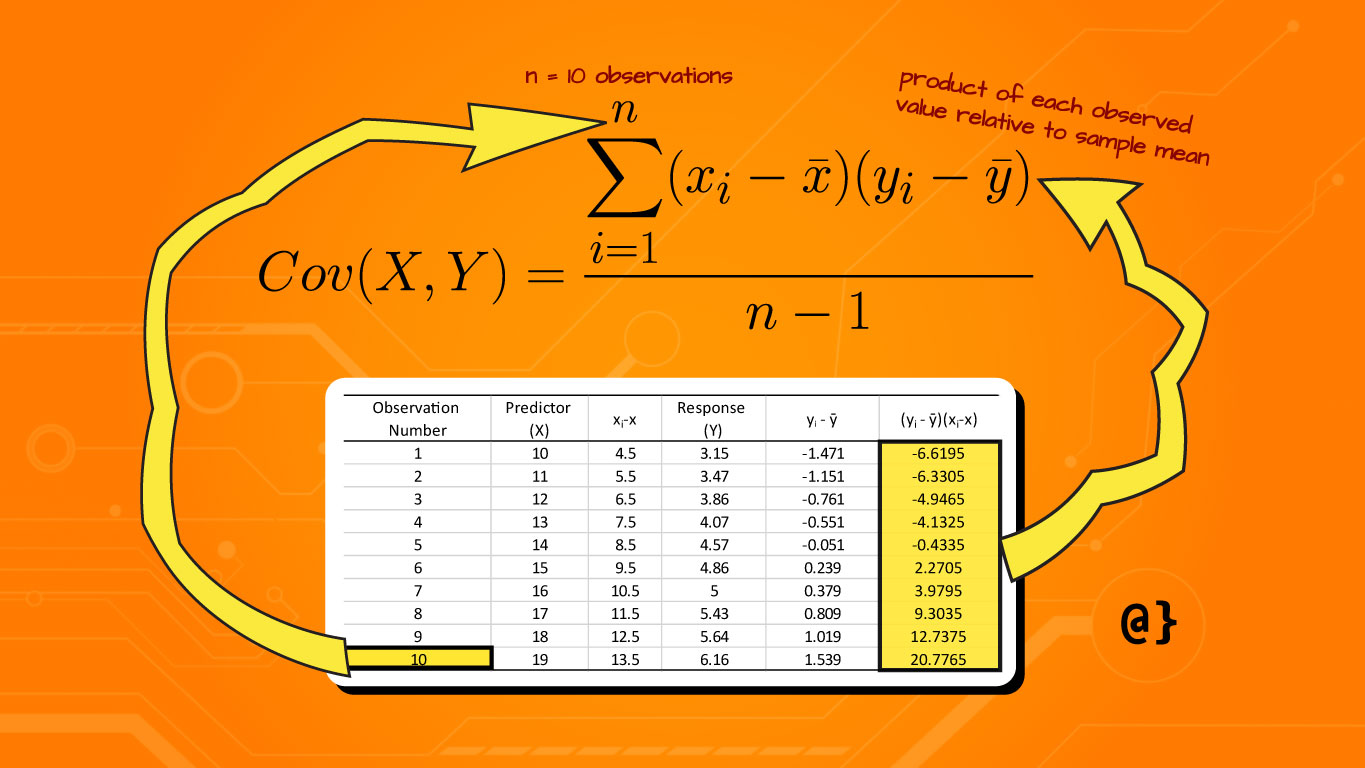
The formula for calculating covariance is a fundamental concept in statistics, and it’s essential to understand it to accurately analyze data in Excel. The covariance formula is denoted by the symbol σ (sigma) and is calculated as follows: σ(x, y) = Σ[(xi – x̄)(yi – ȳ)] / (n – 1), where xi and yi are individual data points, x̄ and ȳ are the means of the two variables, and n
Using Excel Functions: A Simplified Approach to Calculating Covariance
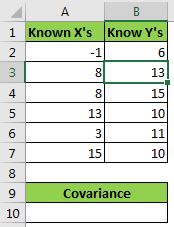
While understanding the formula for calculating covariance is essential, Excel provides a more straightforward approach to calculating covariance using built-in functions. The COVAR and COVARIANCE.S functions are two popular options for calculating covariance in Excel. To use the COVAR function, simply enter “=COVAR(array1, array2)” where array1 and array2 are the ranges of cells containing the data for the two variables. For example, if you have data for variable X in cells A1:A10 and data for variable Y in cells B1:B10, you would enter “=COVAR(A1:A10, B1:B10)”. The COVARIANCE.S function is similar, but it ignores blank cells and is more suitable for datasets with missing values. By using these Excel functions, you can quickly and easily calculate covariance, making it easier to understand the relationship between two variables and how to find covariance on Excel.
Real-World Applications: How Covariance is Used in Finance and Economics
Covariance plays a crucial role in various real-world applications, particularly in finance and economics. In finance, covariance is used to calculate the risk of a portfolio of assets. By understanding the covariance between different assets, investors can diversify their portfolios to minimize risk and maximize returns. For instance, if two stocks have a high positive covariance, it means that their prices tend to move together. In this case, investors may want to diversify their portfolio by investing in stocks with low or negative covariance to reduce overall risk. In economics, covariance is used to analyze the relationship between macroeconomic variables, such as GDP and inflation rate. By understanding the covariance between these variables, economists can better predict the impact of policy changes on the economy. Additionally, covariance is used in risk management to identify potential risks and opportunities in financial markets. By learning how to find covariance on Excel, professionals in finance and economics can make more informed decisions and drive business success.
:max_bytes(150000):strip_icc()/Covariance_Final_4198606-4966d054fe4a4d30b72bcf77c1db21cd.jpg)
Common Errors to Avoid When Calculating Covariance in Excel
When calculating covariance in Excel, it’s essential to avoid common errors that can lead to inaccurate results. One of the most common mistakes is incorrect data formatting. Ensure that the data is in a numerical format, and there are no blank cells or text values in the range. Another error to watch out for is formula errors, such as incorrect syntax or mismatched ranges. To avoid this, double-check the formula and ensure that the ranges are correct. Additionally, be cautious when using the COVAR and COVARIANCE.S functions, as they can produce different results depending on the data. By understanding how to find covariance on Excel and avoiding these common errors, users can ensure accurate and reliable results. It’s also important to note that covariance is sensitive to outliers, so it’s essential to clean and preprocess the data before calculating covariance. By being aware of these potential pitfalls, users can confidently calculate covariance in Excel and make informed decisions.
Interpreting Covariance Results: What Do the Numbers Mean?
Once the covariance is calculated, it’s essential to understand what the results mean. The covariance value can be positive, negative, or zero, each indicating a different relationship between the two variables. A positive covariance indicates that the variables tend to move together, while a negative covariance suggests that they move in opposite directions. A zero covariance implies that the variables are independent. The magnitude of the covariance value also provides valuable information. A large covariance value indicates a strong relationship between the variables, while a small value suggests a weak relationship. When learning how to find covariance on Excel, it’s crucial to understand how to interpret the results to make informed decisions. For instance, in finance, a positive covariance between two stocks may indicate that they are highly correlated, and investors may want to diversify their portfolio to minimize risk. By understanding the covariance results, users can gain valuable insights into the relationships between variables and make data-driven decisions.

Advanced Techniques: Using Covariance in Regression Analysis and Beyond
In addition to understanding the basics of covariance, users can take their data analysis skills to the next level by applying covariance in advanced statistical models. One such application is in regression analysis, where covariance is used to quantify the relationship between the independent and dependent variables. By understanding how to find covariance on Excel, users can calculate the covariance between the residuals and the fitted values, providing valuable insights into the model’s performance. Furthermore, covariance can be used in other statistical models, such as principal component analysis (PCA) and factor analysis, to identify patterns and relationships in high-dimensional data. In PCA, covariance is used to identify the directions of maximum variance, while in factor analysis, it is used to identify the underlying factors that explain the correlations between variables. By mastering these advanced techniques, users can unlock the full potential of covariance in Excel and gain a deeper understanding of their data.

Conclusion: Mastering Covariance in Excel for Data Analysis Success
In conclusion, understanding how to find covariance on Excel is a crucial skill for any data analyst. By mastering the concept of covariance, users can unlock the power of data analysis and gain valuable insights into the relationships between variables. From calculating covariance using formulas or Excel functions to interpreting the results and applying advanced techniques, this article has provided a comprehensive guide to covariance in Excel. By following the steps and tips outlined in this article, users can avoid common errors and ensure accurate calculations. As data analysis continues to play an increasingly important role in business and finance, mastering covariance in Excel is essential for making informed decisions and driving success. With practice and patience, users can become proficient in calculating covariance and take their data analysis skills to the next level.