Understanding the Role of Swap Rates in Financial Markets
In the realm of financial markets, swap rates play a pivotal role in shaping interest rates, investments, and economic growth. As a key indicator of market sentiment, swap rates have a profound impact on borrowing costs, mortgage rates, and investment decisions. A thorough understanding of swap rates is essential for investors, policymakers, and businesses seeking to navigate the complexities of the global economy.

Click Image to Find Quantum Products
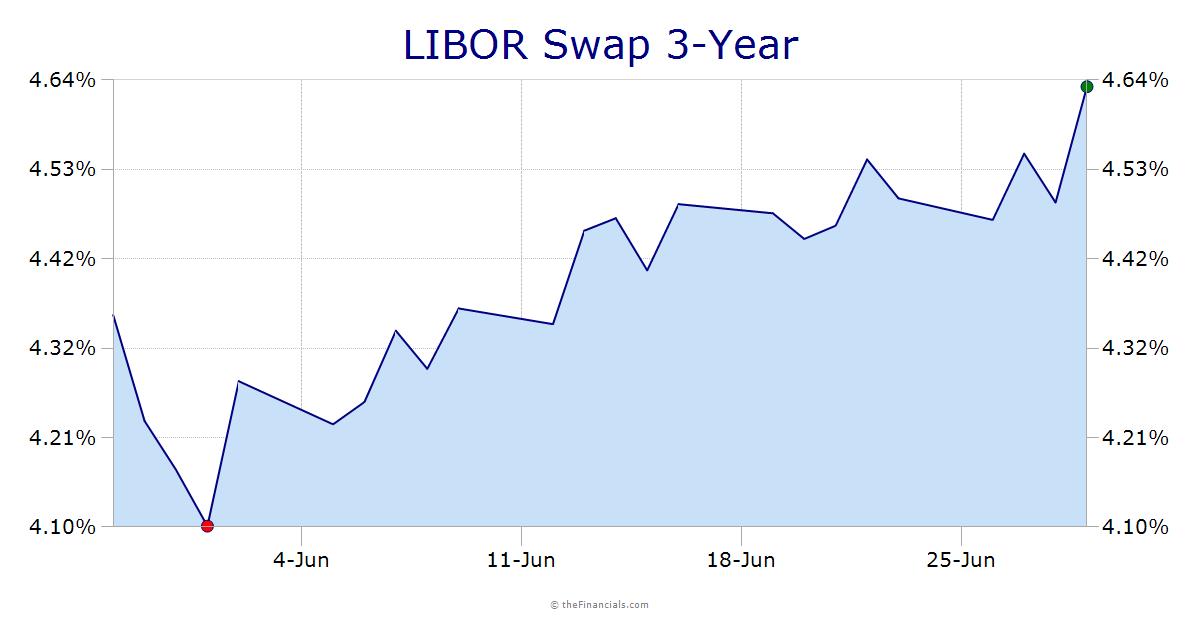
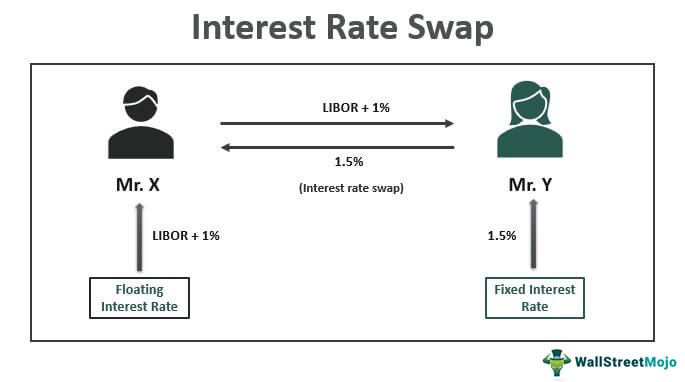
Swap rates are essentially interest rates that are fixed for a specific period, typically ranging from a few months to several years. This fixed rate is exchanged for a floating rate, which is often tied to a benchmark rate, such as the London Interbank Offered Rate (LIBOR). The resulting swap rate reflects the market’s expectation of future interest rates, making it a crucial indicator for those seeking to optimize their returns.
As a result, understanding the role of swap rates in financial markets is vital for making informed investment decisions, managing risk, and staying ahead of the curve in an ever-changing economic landscape. In the following sections, we will delve deeper into the world of swap rates, exploring the concept of 10-year swap rates and the significance of 10 year swap rate charts in investment decisions.
What is a 10-Year Swap Rate and How Does it Affect You?
A 10-year swap rate is a type of interest rate swap that involves exchanging a fixed rate for a floating rate over a 10-year period. This fixed rate is determined by market forces and reflects the market’s expectation of future interest rates. The 10-year swap rate is a crucial indicator of long-term interest rates, influencing borrowing costs, mortgage rates, and investment decisions.
The calculation of the 10-year swap rate involves a complex process, taking into account various market factors, such as the yield curve, inflation expectations, and monetary policy. The resulting rate is a benchmark for long-term interest rates, providing a snapshot of market sentiment and expectations.
The impact of the 10-year swap rate is far-reaching, affecting various aspects of the economy and financial markets. For instance, a rise in the 10-year swap rate can increase borrowing costs, making it more expensive for individuals and businesses to access credit. This, in turn, can affect consumer spending, business investment, and economic growth. On the other hand, a decline in the 10-year swap rate can lead to lower borrowing costs, stimulating economic activity and investment.
In addition, the 10-year swap rate has a significant influence on investment decisions, particularly in the fixed-income market. Investors seeking to optimize their returns often rely on 10-year swap rate charts to inform their investment strategies, identifying opportunities and managing risk in the process. As such, understanding the 10-year swap rate and its implications is essential for investors, policymakers, and businesses seeking to navigate the complexities of the global economy.
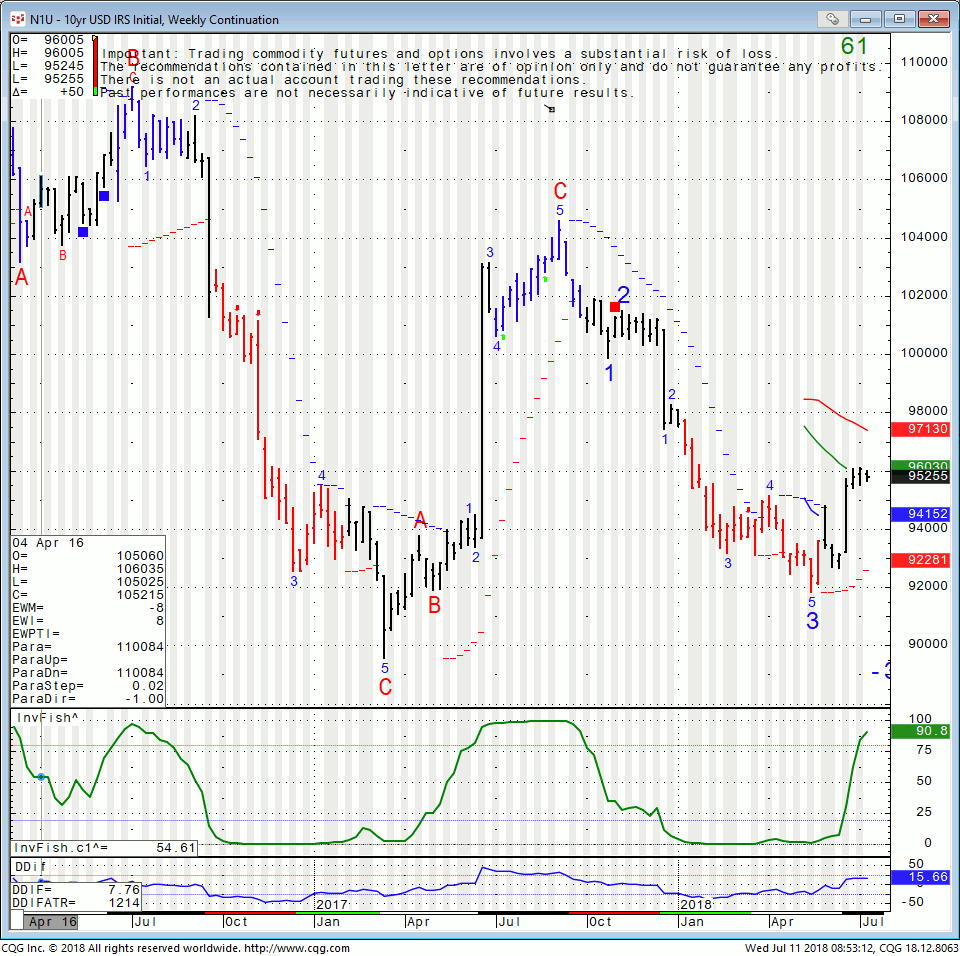
How to Read and Interpret a 10-Year Swap Rate Chart
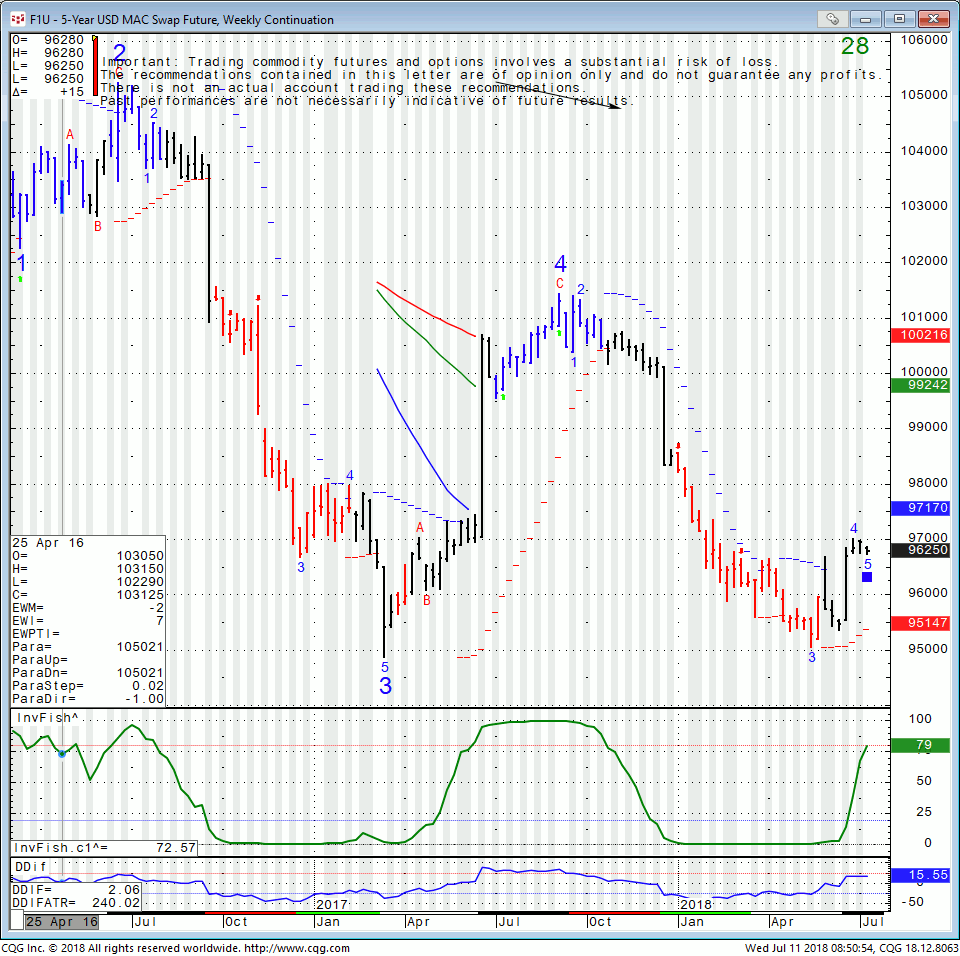
When it comes to analyzing 10-year swap rates, understanding how to read and interpret a 10-year swap rate chart is crucial for making informed investment decisions. A 10-year swap rate chart provides a visual representation of the swap rate over a specific period, allowing investors to identify trends, patterns, and correlations. In this section, we will provide a step-by-step guide on how to read and interpret a 10-year swap rate chart.
Step 1: Understanding the X-Axis
The x-axis of a 10-year swap rate chart typically represents the time period, with dates ranging from the present day to a specified date in the future. This axis provides a timeline for the swap rate, allowing investors to track changes over time.
Step 2: Understanding the Y-Axis
The y-axis of a 10-year swap rate chart represents the swap rate itself, expressed as a percentage. This axis provides a scale for the swap rate, allowing investors to compare rates across different time periods.
Step 3: Identifying Trends and Patterns
By analyzing the 10-year swap rate chart, investors can identify trends and patterns in the swap rate. An upward trend may indicate a rise in interest rates, while a downward trend may indicate a decline. Identifying these trends and patterns is essential for making informed investment decisions.
Step 4: Analyzing Correlations
A 10-year swap rate chart can also be used to analyze correlations between the swap rate and other economic indicators, such as GDP growth, inflation, or monetary policy. By identifying these correlations, investors can gain a deeper understanding of the factors driving the swap rate and make more informed investment decisions.
Step 5: Using 10-Year Swap Rate Charts for Investment Decisions
By following these steps, investors can use 10-year swap rate charts to inform their investment decisions. For instance, a rising 10-year swap rate may indicate a good time to invest in fixed-income securities, while a declining rate may indicate a good time to invest in equities. By understanding how to read and interpret a 10-year swap rate chart, investors can optimize their returns and manage risk more effectively.
In conclusion, a 10-year swap rate chart is a powerful tool for investors seeking to understand the complexities of long-term interest rates. By following these steps, investors can unlock the secrets of the 10-year swap rate chart and make more informed investment decisions.
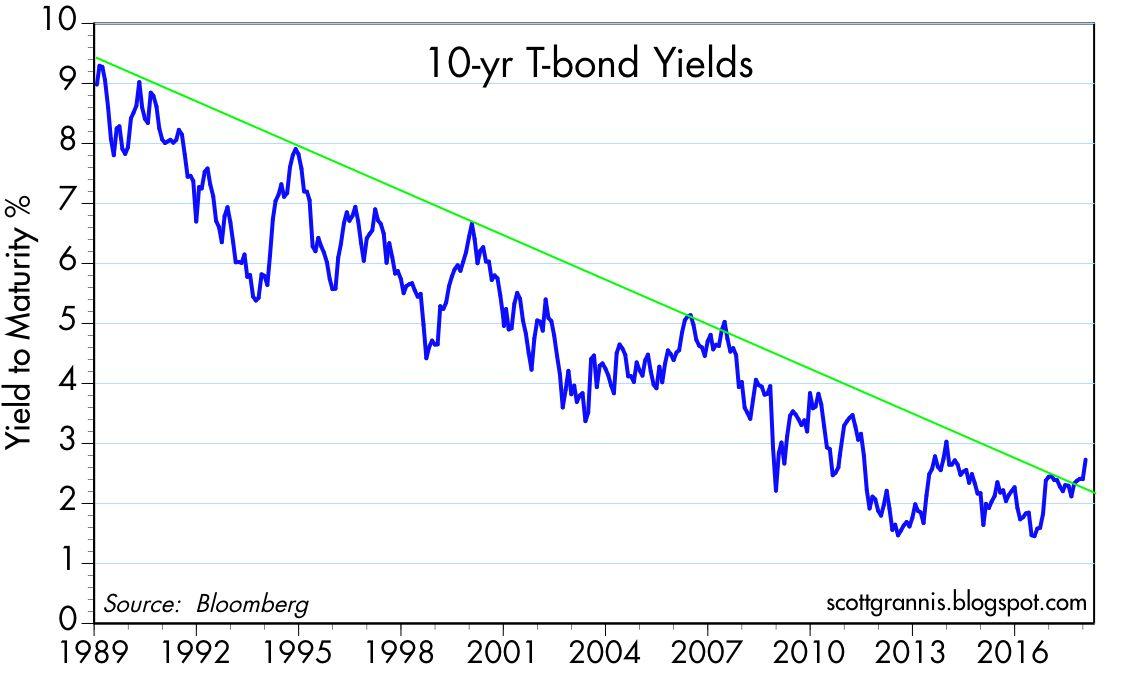
Historical Trends and Patterns in 10-Year Swap Rates
Analyzing historical data is essential for understanding the trends and patterns in 10-year swap rates. By examining the past behavior of 10-year swap rates, investors can gain valuable insights into the factors that influence these rates and make more informed investment decisions.
One of the most significant trends in 10-year swap rates is the impact of monetary policy. During times of economic downturn, central banks often implement expansionary monetary policies, such as quantitative easing, to stimulate economic growth. This can lead to a decrease in 10-year swap rates, making borrowing cheaper and stimulating investment. Conversely, during times of economic growth, central banks may implement contractionary monetary policies, such as raising interest rates, to curb inflation and prevent overheating. This can lead to an increase in 10-year swap rates, making borrowing more expensive and reducing investment.
Another significant trend in 10-year swap rates is the impact of economic events. Major economic events, such as recessions or global financial crises, can have a profound impact on 10-year swap rates. For instance, during the 2008 global financial crisis, 10-year swap rates plummeted as investors sought safe-haven assets and central banks implemented emergency monetary policies. Similarly, during times of economic growth, 10-year swap rates may rise as investors become more optimistic about the economy and seek higher returns.
Market sentiment also plays a crucial role in shaping 10-year swap rates. When market sentiment is positive, investors are more likely to take on risk, leading to higher 10-year swap rates. Conversely, when market sentiment is negative, investors are more likely to seek safe-haven assets, leading to lower 10-year swap rates.
By analyzing these historical trends and patterns, investors can gain a deeper understanding of the factors that influence 10-year swap rates and make more informed investment decisions. For instance, by identifying the impact of monetary policy on 10-year swap rates, investors can adjust their investment strategies to take advantage of changes in interest rates. Similarly, by understanding the impact of economic events and market sentiment on 10-year swap rates, investors can better navigate market volatility and optimize their returns.
In addition, analyzing historical data can also help investors identify potential opportunities and risks in the market. By examining the behavior of 10-year swap rates during different economic conditions, investors can identify potential investment opportunities and adjust their strategies accordingly. For instance, during times of low interest rates, investors may seek to invest in fixed-income securities, while during times of high interest rates, investors may seek to invest in equities.
Overall, analyzing historical trends and patterns in 10-year swap rates is essential for investors seeking to navigate the complexities of financial markets. By understanding the factors that influence 10-year swap rates, investors can make more informed investment decisions and optimize their returns.
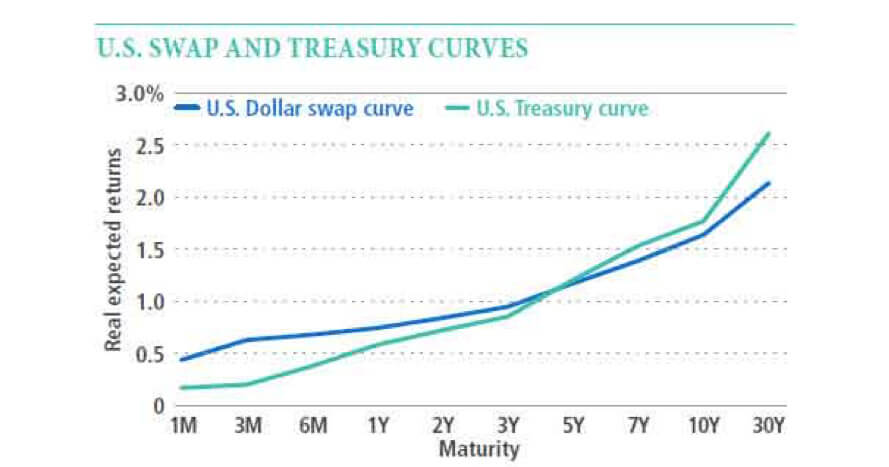
The Relationship Between 10-Year Swap Rates and Bond Yields
The 10-year swap rate and bond yields are two closely related concepts in the world of finance. Understanding the correlation between these two metrics is crucial for investors seeking to optimize their returns and manage risk.
A 10-year swap rate represents the fixed leg of a swap agreement, where two parties agree to exchange fixed and floating interest payments based on a notional amount. Bond yields, on the other hand, represent the return on investment for a bondholder. While these two metrics seem distinct, they are intricately linked, and changes in one can have a significant impact on the other.
When 10-year swap rates rise, it can lead to an increase in bond yields. This is because investors demand higher returns to compensate for the increased risk of lending. Conversely, when 10-year swap rates fall, bond yields may also decrease, making borrowing cheaper and stimulating investment. This inverse relationship between 10-year swap rates and bond yields is a key concept for investors to grasp.
The correlation between 10-year swap rates and bond yields can also be influenced by macroeconomic factors. For instance, during times of economic growth, central banks may raise interest rates to curb inflation, leading to an increase in 10-year swap rates and bond yields. Conversely, during times of economic downturn, central banks may lower interest rates to stimulate growth, leading to a decrease in 10-year swap rates and bond yields.
Investors can use this correlation to their advantage by analyzing 10-year swap rate charts and bond yield curves. By identifying trends and patterns in these metrics, investors can make more informed investment decisions, such as identifying opportunities to invest in fixed-income securities or optimizing their portfolio allocation.
For example, if an investor observes a rising trend in 10-year swap rates, they may anticipate an increase in bond yields and adjust their investment strategy accordingly. This could involve shifting their portfolio towards shorter-term bonds or investing in assets that are less sensitive to interest rate changes.
In conclusion, the relationship between 10-year swap rates and bond yields is a complex and dynamic one. By understanding the correlation between these two metrics, investors can gain valuable insights into the market and make more informed investment decisions. Whether you’re a seasoned investor or just starting out, analyzing 10-year swap rate charts and bond yield curves can help you optimize your returns and navigate the complexities of financial markets.
Using 10-Year Swap Rate Charts for Investment Decisions
Investors seeking to optimize their returns and manage risk can greatly benefit from analyzing 10-year swap rate charts. These charts provide valuable insights into the market, enabling investors to make informed decisions about their investments.
A 10-year swap rate chart can help investors identify opportunities in the fixed-income market. By analyzing the chart, investors can determine whether the current swap rate is high or low compared to historical levels. This information can be used to inform investment decisions, such as whether to invest in long-term bonds or opt for shorter-term instruments.
One key benefit of using 10-year swap rate charts is that they can help investors manage risk. By analyzing the chart, investors can identify trends and patterns in swap rates, which can indicate potential changes in interest rates and bond yields. This information can be used to adjust investment portfolios and minimize exposure to potential losses.
For example, if an investor observes a rising trend in 10-year swap rates, they may anticipate an increase in bond yields and adjust their portfolio accordingly. This could involve shifting their investment focus towards shorter-term bonds or investing in assets that are less sensitive to interest rate changes.
In addition to identifying opportunities and managing risk, 10-year swap rate charts can also be used to optimize returns. By analyzing the chart, investors can identify the most attractive investment opportunities and allocate their portfolio accordingly. This can involve investing in bonds with higher yields or opting for alternative investments that offer more attractive returns.
Furthermore, 10-year swap rate charts can be used in conjunction with other market data to gain a more comprehensive understanding of the market. By combining swap rate data with other metrics, such as GDP growth rates and inflation data, investors can gain a more nuanced understanding of the market and make more informed investment decisions.
In conclusion, 10-year swap rate charts are a valuable tool for investors seeking to optimize their returns and manage risk. By analyzing these charts, investors can identify opportunities, manage risk, and optimize returns, ultimately leading to more successful investment outcomes. Whether you’re a seasoned investor or just starting out, incorporating 10-year swap rate charts into your investment strategy can help you achieve your financial goals.
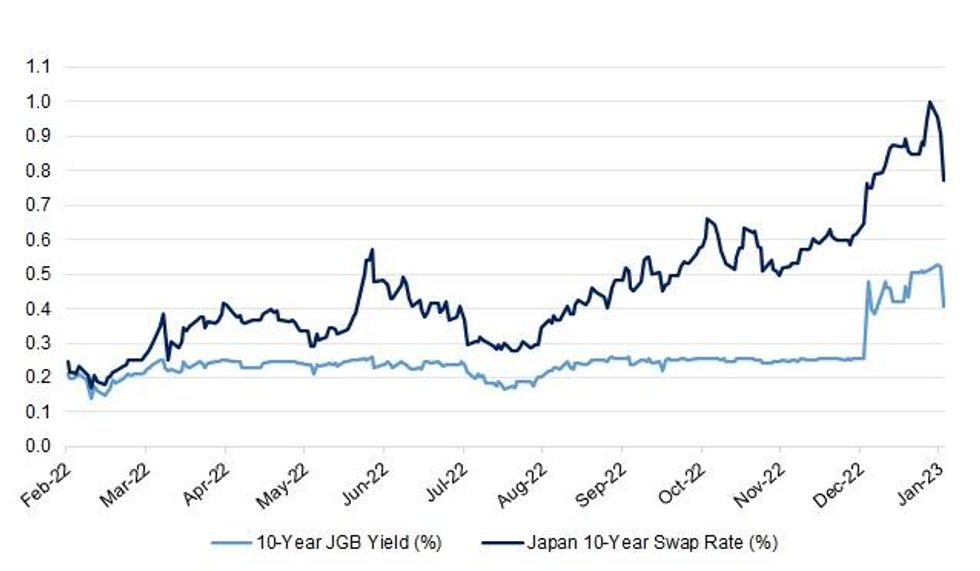
Comparing 10-Year Swap Rates Across Different Economies
When analyzing 10-year swap rates, it’s essential to consider the differences in monetary policies, economic conditions, and investment opportunities across various economies. By comparing 10-year swap rates across different economies, investors can gain a deeper understanding of the global market and identify potential investment opportunities.
In the United States, for example, the 10-year swap rate is heavily influenced by the Federal Reserve’s monetary policy decisions. In contrast, the European Union’s 10-year swap rate is affected by the European Central Bank’s policies, as well as the economic conditions of individual member states. Similarly, the 10-year swap rate in Japan is influenced by the Bank of Japan’s policies and the country’s unique economic conditions.
By comparing 10-year swap rates across these economies, investors can identify potential arbitrage opportunities. For instance, if the 10-year swap rate in the United States is significantly higher than in the European Union, investors may consider investing in U.S. bonds or other fixed-income instruments. Conversely, if the 10-year swap rate in Japan is lower than in other economies, investors may consider investing in Japanese bonds or other assets.
In addition to identifying arbitrage opportunities, comparing 10-year swap rates across different economies can also provide insights into the relative attractiveness of different investment markets. For example, if the 10-year swap rate in a particular economy is consistently higher than in other economies, it may indicate a higher demand for borrowing and a more attractive investment environment.
Furthermore, analyzing 10-year swap rates across different economies can also help investors understand the impact of global economic events on interest rates and investment opportunities. For instance, during times of global economic uncertainty, 10-year swap rates may increase across multiple economies, indicating a higher demand for safe-haven assets and a more cautious investment environment.
In conclusion, comparing 10-year swap rates across different economies is essential for investors seeking to optimize their returns and manage risk. By analyzing these rates, investors can identify arbitrage opportunities, understand the relative attractiveness of different investment markets, and gain insights into the impact of global economic events on interest rates and investment opportunities. Whether you’re a seasoned investor or just starting out, incorporating a global perspective into your investment strategy can help you achieve your financial goals.
The Future of 10-Year Swap Rates: Trends and Predictions
As the global economy continues to evolve, the future of 10-year swap rates remains uncertain. However, by analyzing historical trends and patterns, as well as current market conditions, investors can gain insights into potential trends and predictions.
One potential trend is the continued impact of central banks’ monetary policies on 10-year swap rates. As central banks adjust their policies to respond to changing economic conditions, 10-year swap rates are likely to be affected. For example, if central banks implement policies to stimulate economic growth, 10-year swap rates may decrease, making borrowing cheaper and increasing investment opportunities.
Another potential trend is the increasing importance of 10-year swap rate charts in investment decisions. As investors become more sophisticated and data-driven, the use of 10-year swap rate charts is likely to become more widespread. This could lead to a greater emphasis on technical analysis and a more nuanced understanding of the relationship between 10-year swap rates and bond yields.
In terms of predictions, some experts believe that 10-year swap rates will continue to rise in the short term, driven by increasing inflation expectations and a tightening labor market. However, others predict that 10-year swap rates will remain low, driven by continued central bank intervention and a lack of inflationary pressure.
Regardless of the outcome, one thing is clear: 10-year swap rates will continue to play a critical role in shaping the investment landscape. By understanding the trends and patterns in 10-year swap rates, investors can make more informed decisions and optimize their returns. Whether you’re a seasoned investor or just starting out, incorporating 10-year swap rate charts into your investment strategy can help you achieve your financial goals.
For example, investors can use 10-year swap rate charts to identify potential opportunities in the fixed-income market. By analyzing the chart, investors can determine whether the current 10-year swap rate is high or low compared to historical levels, and adjust their investment strategy accordingly. This could involve investing in bonds with higher yields or opting for alternative investments that offer more attractive returns.
In conclusion, the future of 10-year swap rates is uncertain, but by analyzing historical trends and patterns, as well as current market conditions, investors can gain insights into potential trends and predictions. By incorporating 10-year swap rate charts into their investment strategy, investors can make more informed decisions and optimize their returns.